
The best offshore fishing app is the one whose data you will actually read before you run. Six satellite chart services compared on SST updates, chlorophyll, altimetry, offline navigation, and price, with the strengths of each and who each one suits.
Choosing the Best Offshore Fishing App
The Best Offshore Fishing Apps for Finding Fish Faster
The best offshore fishing app is the one that puts current satellite data in front of you before you burn fuel running to the wrong water. Sea surface temperature, chlorophyll, and altimetry charts show where temperature breaks, color changes, and current edges sit today, and those edges are where bait and pelagics concentrate. Every app below delivers that data, but they differ in how often it updates, how it is processed, how well it works offshore without a signal, and what it costs.
If you are new to reading these charts, start with our article on using satellite fishing maps before you head offshore, then come back to choose the tool.
Key Features for Offshore Fishing Apps
Before comparing apps, know what you are paying for.
Real-Time Satellite Data
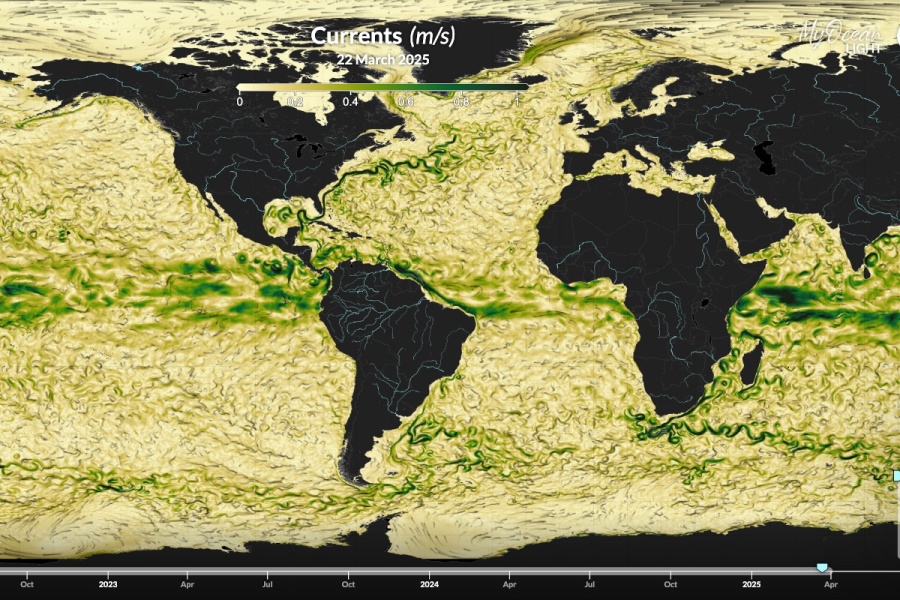
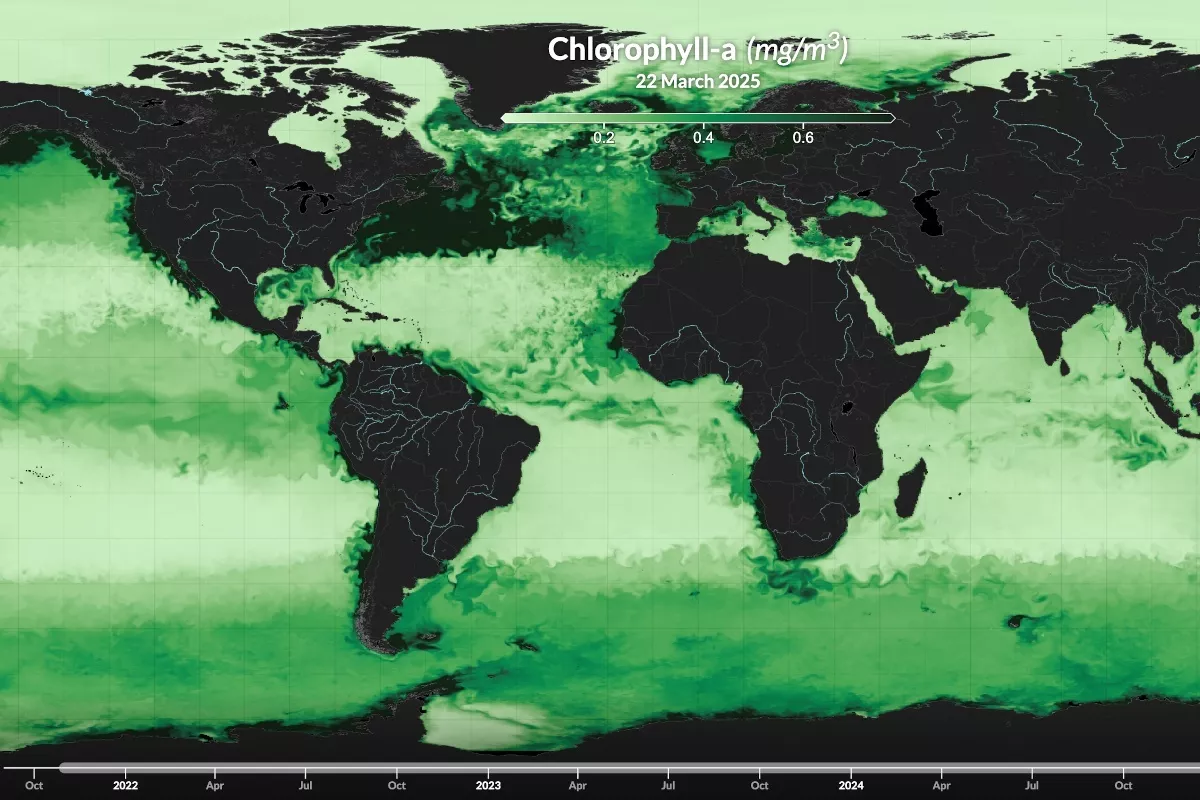
Sea surface temperature (SST) is the core layer. Temperature breaks concentrate bait and the fish that feed on it, so the number of usable SST passes per day, and how the app handles cloud cover, matters more than almost anything else. Chlorophyll shows water color, the line between blue, green, and dirty water that many pelagic species work. Altimetry, or sea surface height, shows current eddies and edges where water converges and upwells. Our article on reading altimetry charts covers how to use that layer.
Bathymetry and Navigation
Bottom structure explains why a temperature break holds fish in one place and not another. Look for bathymetry overlays that show canyons, ridges, seamounts, and drop-offs under the satellite imagery, GPS that shows your boat's position on the chart, and offline maps. Once you are past cell range, an app that cannot show saved charts is no help.
Weather Forecasting
Some apps include marine forecasts for wind, waves, and swell, along with buoy data. That keeps trip planning in one place, though most captains still check a dedicated marine forecast before committing to a run.
Understanding Satellite Maps for Fishing
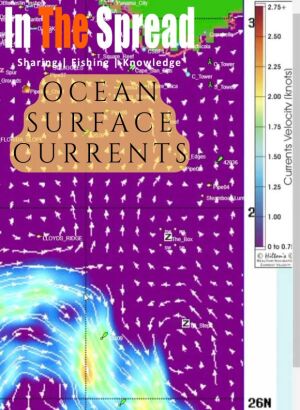
Ocean surface currents concentrate baitfish and gamefish in predictable zones revealed through satellite image analysis. Understanding arrow patterns for current direction and speed, identifying upwelling and downwelling zones where vertical movement affects prey, and recognizing warm core eddies that trap bait transforms random offshore searching into informed decisions about where conditions align to create prime fishing locations.
Moderate chlorophyll concentrations outperform both extremely low and extremely high levels for pelagic fishing because very dense blooms sometimes create conditions predators avoid. Tom Hilton explains interpreting color gradients from blues indicating barren water through greens and yellows showing productive zones, and why combining chlorophyll with temperature and current data identifies where complete food chains support apex predators.
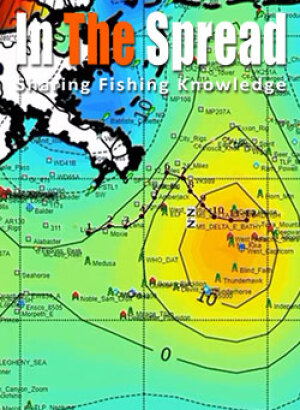
Temperature and chlorophyll satellites show surface conditions but miss the vertical water movements driving productivity. Tom Hilton explains how altimetry reveals upwelling bringing nutrients from depth versus downwelling pulling them away, why upwelling edges outperform centers for predator positioning, and what sea surface height variations indicate about food chain sustainability.
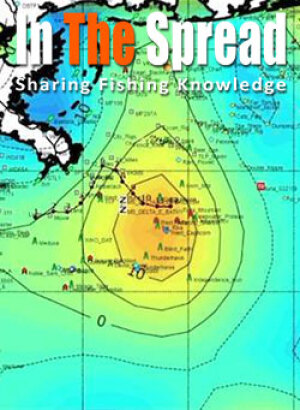
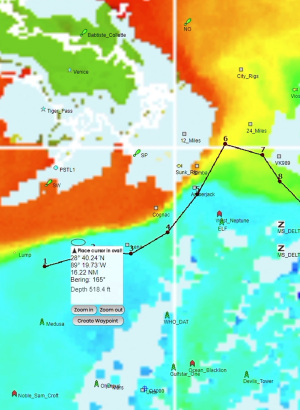
Offshore anglers running without satellite data waste fuel searching randomly for oceanographic features that satellite imagery reveals precisely. Thomas Hilton explains what sea surface temperature breaks, chlorophyll concentrations, and altimetry show about fish positioning, how combining multiple data layers identifies high-probability zones, and why real-time updates matter when features shift daily.
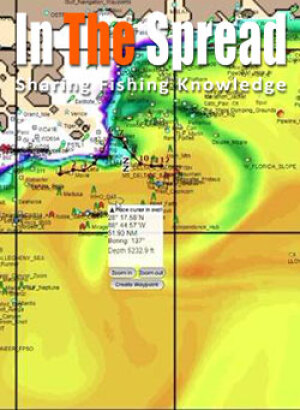
Debate over salinity chart utility stems from satellite showing only surface conditions while many species position at depth. Learn what purple to maroon color transitions reveal about freshwater and saltwater mixing zones, why king mackerel concentrate along these gradients, and when nearshore applications work better than offshore tuna scenarios.
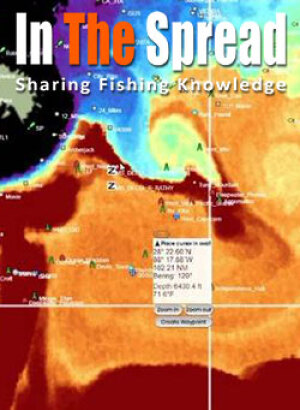
Blue marlin preferring 78 to 88 degrees differs from wahoo favoring cooler break edges, making species-specific SST interpretation critical. Learn identifying temperature gradients where water masses collide, why breaks without chlorophyll may hold no fish despite perfect temps, and how daily shifts mean yesterday's productive water may be miles from current locations.
Top Offshore Fishing Apps
Prices below are as listed by each developer or in the App Store in October 2026. Check current pricing before you subscribe.
SatFish
SatFish is built around high-resolution imagery and bathymetry. It lists 6 to 8 high-resolution SST images per day, one cloud-free SST image and one 3-day composite per day, 2 to 3 chlorophyll images per day, true color imagery, and daily sea surface height and surface current maps. Bathymetry with depth contours and marked hot spots sits under the imagery, and route planning tools let you plan and print a route before you leave.
The free iOS and Android app takes SatFish charts offshore and offline, and the service adds real-time buoy data and a 5-day wind forecast. SatFish costs $129 per year, with a 30-day free trial.
Subscription Options:
- Annual Subscription: $129 per year (Use code SLICK20 for a $20 discount)
- 30-day free trial available
RipCharts
RipCharts is built for analysis. Its app lists sub-surface temperature at 0, 25, 50, and 100 meters, a 5-day SST forecast, and map animations that show water movement over time. You can overlay bathymetry, altimetry, currents, and Loran layers, compare one map layer against another, save imagery for offline use, and navigate on saved imagery with GPS using a "Go Here" tool that shows bearing, ETA, and speed. In the Gulf of Mexico it also tracks floater oil rig positions.
RipCharts comes in two tiers. Standard, at $99 per year, is web only, with 4 to 8 SST updates per day, daily chlorophyll, altimetry, currents, and cloud-free SST, customizable temperature ranges, and Loran grids for the US Gulf of Mexico and East Coast. Premium, at $169 per year, raises SST to 8 to 20 updates per day and chlorophyll and true color to 2 to 3, adds enhanced SST, sub-surface temperatures, the 5-day SST forecast, salinity, and Gulf of Mexico rig updates, and is the only tier that includes the iOS and Android apps with offline maps and offline navigation. In the App Store, single regions are listed at $169.99 and a US and Baja package at $229.99.
RipCharts comes in two tiers. Standard, at $99 per year, is web only, with 4 to 8 SST updates per day, daily chlorophyll, altimetry, currents, and cloud-free SST, customizable temperature ranges, and Loran grids for the US Gulf of Mexico and East Coast. Premium, at $169 per year, raises SST to 8 to 20 updates per day and chlorophyll and true color to 2 to 3, adds enhanced SST, sub-surface temperatures, the 5-day SST forecast, salinity, and Gulf of Mexico rig updates, and is the only tier that includes the iOS and Android apps with offline maps and offline navigation. In the App Store, single regions are listed at $169.99 and a US and Baja package at $229.99.
FishTrack
FishTrack focuses on clean, cloud-free SST imagery, along with chlorophyll and true color images. The app adds currents, tides, moon phase, and a 7-day marine forecast for swell, wind, and weather, and it lets you mark and name hot spots, measure distance, plot routes, and save chart imagery for offline use offshore. Premium adds the latest imagery and overlays for currents, bathymetry, and altimetry.
FishTrack says its coverage includes most of the world's top fishing regions, and it is available on iOS and Android with a free version and a Premium upgrade. The App Store lists Premium at $14.99 per month or $95.99 per year.
FishTrack says its coverage includes most of the world's top fishing regions, and it is available on iOS and Android with a free version and a Premium upgrade. The App Store lists Premium at $14.99 per month or $95.99 per year.
BigBlue Offshore Fishing
BigBlue, from GeoPelagic, offers global coverage with hourly updates as satellite passes arrive. Its App Store listing describes 9 daily SST scans from MODIS, VIIRS, and GHRSST satellites, chlorophyll from 6 daily sources, and true color imagery, plus species habitat information for tuna, billfish, wahoo, mahi, cobia, and yellowtail.
Charts cache automatically as you view them, so they stay available offshore without a signal, and the app shows your live position, speed, and heading on the satellite charts, with waypoints and a distance tool. BigBlue also offers NMEA and AIS links. BigBlue is on iOS and Android, and its desktop app for Mac and Windows comes with its professional plans. The app is free to download with Pro subscriptions sold in the app; the App Store does not list the billing periods, so check pricing in the app.
Salty Offshore
Salty Offshore, from Seamaker Creative, is a newer iOS and iPadOS app that lets you compare sea surface temperature, chlorophyll, currents, salinity, mixed layer depth, and other ocean layers, with shaded seafloor relief shown alongside the conditions. You can set alerts for when new SST or chlorophyll imagery arrives and download regions for offline use. Features vary by plan and region.
The App Store lists Basic at $14.99 per month or $99.99 per year, Pro at $24.99 per month or $199.99 per year, and Elite at $500 per year. It runs on iPhone and iPad, along with Apple silicon Macs and Apple Vision Pro, and it is not listed for Android.
Hilton's Realtime-Navigator
Hilton's Offshore has been producing satellite fishing charts since 2004, and it now covers 34 regions across the Atlantic, Gulf of Mexico, and Pacific coasts and beyond. It lists usually 6 to 12 SST passes per day per region, with customizable imagery, chlorophyll in 1-day, 3-day, and 7-day compilations that can be animated, true color imagery, and altimetry, and its Realtime-Navigator app runs on laptops, iPhones, and iPads. Annual plans start at $200 for the first region plus $30 for each additional region, with one-month access at $74.99.
Hilton's is also the one service on this list taught inside In The Spread. In Thomas Hilton's courses, he walks through reading SST, chlorophyll, altimetry, and salinity charts to build a fishing forecast, which applies no matter which app you end up using.
Comparison of Apps
Data Integration
All six deliver SST and chlorophyll, but they process and present the data differently. RipCharts Premium lists the most SST updates, at 8 to 20 per day, while SatFish lists 6 to 8 high-resolution SST images per day, Hilton's usually 6 to 12 passes per region, and BigBlue 9 daily scans with hourly updates, along with species habitat information. RipCharts stands out for analysis, with sub-surface temperatures down to 100 meters, a 5-day SST forecast, and layer comparisons. FishTrack's strength is clean, cloud-free imagery in a simple interface. Salty Offshore adds mixed layer depth along with salinity.
GPS and Navigation
Five of the six offer saved charts for offline use, which is the feature that matters most once you are past cell range. RipCharts and BigBlue go furthest on navigation, with live position, bearing, and speed on the charts, and BigBlue offers NMEA and AIS links. SatFish and FishTrack cover route planning and saved spots. Salty Offshore lets you download regions before you lose service.
Cost and Subscription Models
None of these are free for the full data. SatFish is $129 per year. RipCharts is $99 per year for the web-only Standard tier or $169 per year for Premium with the mobile apps, and the App Store lists $169.99 per region or $229.99 for the US and Baja package. Salty Offshore ranges from $99.99 to $500 per year depending on the tier. FishTrack Premium is $14.99 per month or $95.99 per year. Hilton's starts at $200 per year for one region plus $30 for each additional region, or $74.99 for a month. BigBlue lists Pro subscriptions in the app without stating billing periods, so check there. Against the fuel cost of one wasted run offshore, any of them can pay for itself quickly.
Summary of Key Points
Satellite chart apps put the same kind of oceanographic data in front of recreational anglers that used to be limited to research and commercial operations. The differences come down to update frequency, processing, analysis tools, offline navigation, and price.
Recommendations
Pick the app that fits how you fish. For a long-running service, in business since 2004, that you can learn inside In The Spread, look at Hilton's. For deep analysis, the most SST updates per day, sub-surface temperatures, and SST forecasts, RipCharts Premium is the tool. For high-resolution imagery with bathymetry at a fixed annual price, SatFish is straightforward. For clean cloud-free imagery in a simple app, FishTrack. For global coverage, species habitat information, and instrument links, BigBlue. For layer stacking that includes mixed layer depth, Salty Offshore.
Many serious crews run two services and compare them before a big run, since one may have a clearer pass or better coverage in a given region on a given day.
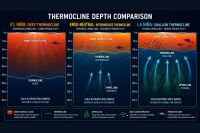
If you want a human analyst's read on the water instead of raw charts, our comparison of offshore satellite fishing map services covers ROFFS, SiriusXM Marine, and the other higher-end options. For how these charts connect to what fish do at depth, see our article on fishing the thermocline.
Login
to leave a review.
User Reviews
There are no reviews yet.
Setting Up a Dredge Pulley for Billfish
Saltwater
12.28.2020
High Speed Wahoo Trolling Rig
Saltwater
09.08.2018
Fishing Light Tackle for Yellowfin Tuna
Saltwater
09.08.2018

0