Start fishing better with FREE Weekly Video Tips delivered straight to your email.
sst
-
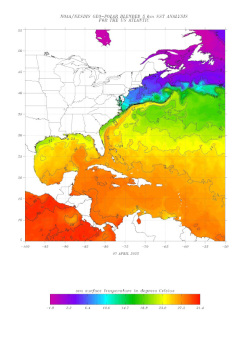
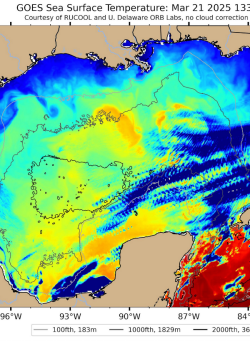
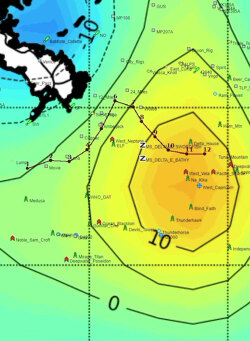
2025, Reading SST Charts to Find Offshore Gamefish
Sea surface temperature charts show you the ocean's thermal structure before you run a mile. Learn to identify the breaks, eddies, and upwellings that concentrate baitfish and pelagic predators, match those features to species-specific temperature ranges, and layer in chlorophyll and altimetry data to build a high-confidence plan the night before your trip.
READ MORE -
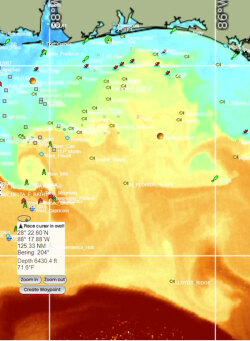
2025, Best Apps for Offshore Fishing
Satellite oceanographic data has changed how serious anglers plan offshore trips. This breakdown of SatFish, RipCharts, FishTrack, and BigBlue covers what each app does best, who it suits, and what the data actually tells you before you run.
READ MORE -
2024, Comparing Offshore Satellite Fishing Map Services
Five satellite fishing services compete for the same angler, but they are not selling the same thing. This breakdown covers what separates ROFFS, SiriusXM Marine, Hilton's Realtime Navigator, SatFish, and RipCharts on the variables that actually matter: update frequency, data layers, expert interpretation, offline access, and price.
READ MORE -
2020, Fishing Temperature Charts: Complete Guide to SST Data for Offshore Success
Sea surface temperature analysis eliminates guesswork in offshore fishing by revealing where target species concentrate along thermal boundaries. Learn to interpret SST charts, identify productive temperature breaks, and position yourself where fish aggregate before competitors arrive.
READ MORE -
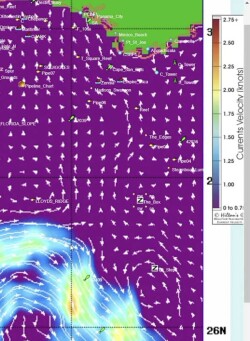
2020, How to Use Altimetry Fishing Charts and Satellite Maps
Satellite altimetry technology transforms offshore fishing by revealing underwater current patterns invisible to traditional methods. Anglers using this scientific approach consistently locate productive upwelling zones where game fish concentrate, achieving higher catch rates and significant fuel savings.
READ MORE