A productive fishing forecast pulls from satellite oceanography, tidal data, barometric pressure, and celestial timing. Each data layer narrows the probability of where fish will be and when they will feed. This article breaks down what each variable tells you, how the layers work together, and how experienced anglers translate data into decisions before they leave the dock.
Reading a Fishing Forecast: Data, Tools, and Decisions
Most anglers check the weather before they go fishing. Serious anglers build a forecast. There is a real difference. A weather check tells you whether it is safe to run. A fishing forecast tells you where the fish are likely to be, why they are there, and when to expect them to feed. Putting those three answers together before you leave the dock is what separates consistent producers from people who just hope for a good day.
Modern fishing forecasts pull from satellite oceanography, atmospheric science, celestial data, and bottom mapping. The technology that was once reserved for commercial fishing fleets and government research vessels is now available on your phone. The challenge is not finding the data. It is knowing which layers matter, how to read them together, and how to act on what they tell you. That is what this article covers.
What Goes Into a Real Fishing Forecast?
A productive fishing forecast is built from several data layers, not a single metric. Each layer narrows the probability window. Stack enough of them in your favor and you stop guessing about where to fish.
- Barometric pressure and its trend over the previous 24 to 48 hours
- Sea surface temperature (SST) and the location of temperature breaks
- Tidal movement and phase relative to your target species
- Surface current direction and speed, which determine how bait and water masses move
- Chlorophyll-a concentration, which maps the base of the food chain
- Altimetry data, which reveals eddies, upwellings, and current edges
- Salinity gradients in regions influenced by river plumes or major freshwater outflow
- Moon phase and solunar periods, which influence peak feeding windows
- Bottom structure, which provides the physical habitat fish relate to
None of these factors works well in isolation. A strong solunar period on dead-calm flat water with no tidal movement is not a reliable bite window. An excellent temperature break in the wrong location relative to structure may hold bait but no predators. The real skill in forecasting is learning how these variables interact, which combinations produce fish, and which conditions override the others.
How Does Barometric Pressure Affect Fishing?
Barometric pressure is one of the most underutilized variables in recreational fishing forecasts, and one of the most consistently useful in angler logs, even if controlled lab studies show mixed results across species. Fish are not passive observers of atmospheric change. Through their swim bladders and lateral line systems, they detect pressure shifts before the weather arrives at the water's surface.
The most productive forecasting metric is not the current pressure reading but the rate and direction of change. A falling barometer ahead of a front often triggers aggressive feeding behavior, particularly in inshore species. Fish seem to recognize that rough weather will restrict feeding opportunities and respond by feeding hard in the hours before conditions deteriorate. Once pressure drops sharply and the front hits, activity typically shuts down. The window before the front is when you want to be on the water.
It is worth noting that experimental work on individual species in controlled tanks has found weak or unclear direct effects of pressure on feeding rate. Multi-year logbooks from guides, however, consistently show catch-rate bumps during falling pressure windows and soft lulls under long-term stable highs. The on-water correlation is real enough to plan around; just do not treat it as a hard switch.
Stable high pressure, while comfortable for boating, often produces the most challenging fishing. Fish become less active and position tighter to structure. The hours immediately after a front passes and pressure begins to climb steadily can also produce solid fishing, particularly for inshore species moving back onto flats and shallow structure.
Why Tides Drive Inshore Fishing Success
For saltwater anglers, tidal movement is the engine of the inshore ecosystem. Current generated by tidal flow concentrates baitfish, disorients prey species, and creates predictable feeding windows that you can plan around.
The general principle is straightforward: moving water produces fish. Slack tide, especially in protected bays and backwater systems, is typically the slowest period of the day. The strongest tidal flow periods, the first two hours of an incoming tide and the last two hours of an outgoing tide, usually align with the most aggressive feeding behavior. Predators station themselves at current breaks, channel mouths, and structure edges where baitfish funnel through and are easy to pick off.
Local tide timing often lags published tables depending on your exact location and wind setup. A strong onshore wind can hold water back on a falling tide or push it higher than predicted on a flood. Build your forecast around what your logbook and local markers show, not just the nearest tide station. Some species also spike their feeding just before or just after slack as bait shifts position and disorientation is highest. Watch your own water for those micro-windows rather than treating every slack period as automatically dead time.
Tidal range matters as much as tidal direction. Spring tides, which occur around new and full moons, create more extreme water level changes and stronger current. That stronger current often produces more aggressive feeding, particularly for species like redfish, snook, and seatrout that use tidal flow to their advantage. Neap tides, which occur around quarter moons, generate weaker current and generally slower fishing in current-dependent environments.
The interaction between tidal phase and solunar periods is worth tracking. When a major solunar period overlaps with a moving tide, you get a compounding effect that many experienced anglers consider the most reliable feeding window available. Understanding how to cross-reference these two variables is covered in depth in the ITS article on solunar calendar fishing and moon phases.
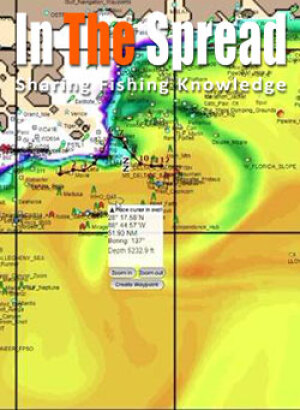
Reading Sea Surface Temperature for Offshore Fishing
Sea surface temperature is the single most important data layer for offshore fishing forecasts. Fish are ectothermic. Their metabolism, activity level, digestion rate, and willingness to feed are all directly tied to water temperature. Understanding SST data means understanding where a given species can physically be comfortable and where it will feed most aggressively.
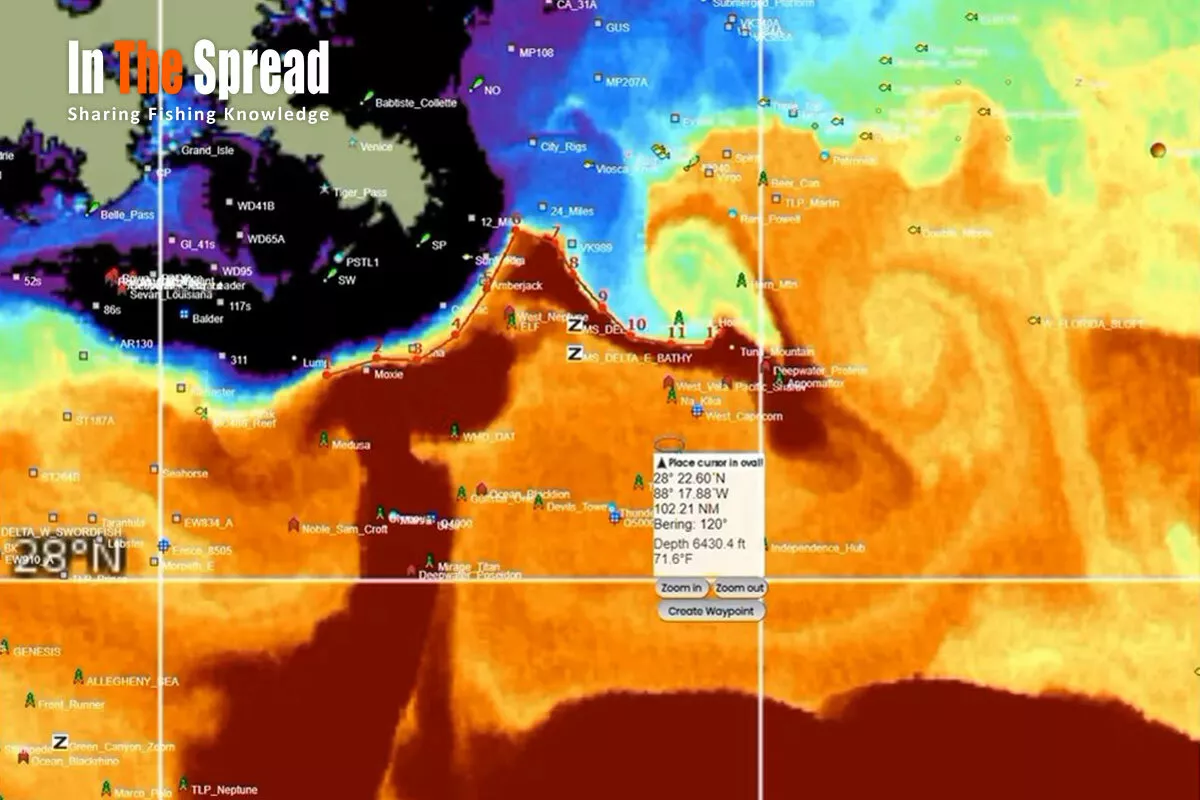
The data point that matters most is not absolute temperature but the location of temperature breaks, areas where water temperature changes sharply over a short horizontal distance. On most satellite charts, a meaningful temperature break is at least 2°F of change per mile or less. A half-degree gradient spread over ten miles is background noise; a two-degree drop in a quarter mile is a real feature worth fishing. These thermal boundaries align with current edges and concentrate marine life in a way that open, uniform-temperature water does not. Baitfish stack along these breaks. Predators hunt the edges. Offshore captains targeting yellowfin tuna, wahoo, marlin, and mahi-mahi treat temperature breaks as primary waypoints before any other consideration.
One practical note: satellite SST measures the skin temperature of the top millimeter or so of the water surface. Your transducer reads temperature slightly deeper, which is why a one- to three-degree discrepancy between the chart and your dash display is completely normal and not a sign that the data is wrong.
- Target the edge of a break, not the warmest water. The hunting zone is the boundary, not the interior of the warm mass.
- Stable breaks that hold their position for two or more days are more productive than breaks that shift daily. Stability indicates a persistent current feature, not a surface disturbance.
- Combine SST with water color. The sharpest breaks often align with the transition from clear blue water to greener, more productive water.
- Seasonal temperature targets vary by species. Wahoo, for example, prefer the cooler side of breaks in the 70 to 76°F range across much of their range, while mahi-mahi often favor warmer water above 78°F.
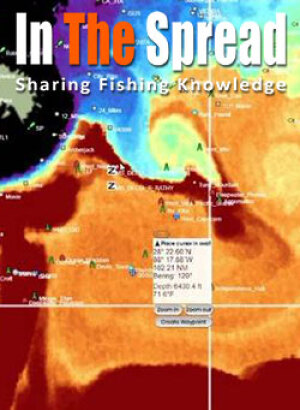
What Do Chlorophyll Charts Tell You About Where Fish Are?
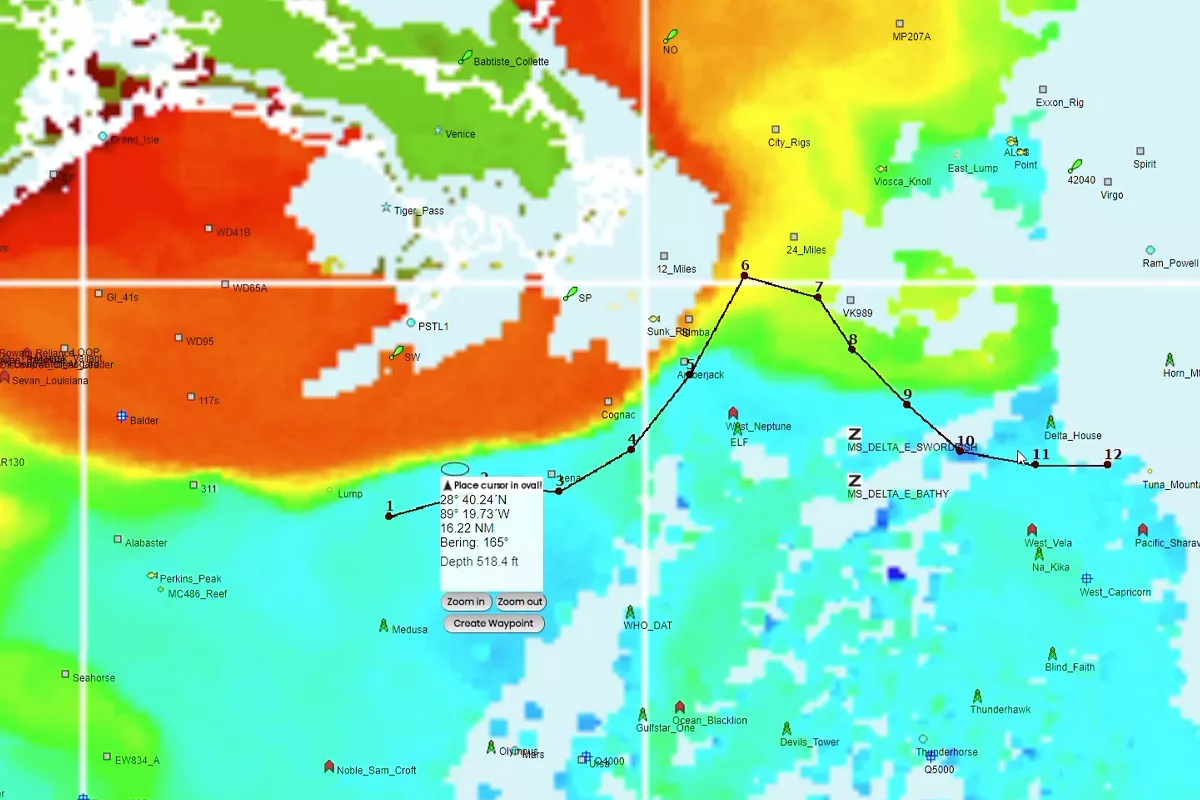
Chlorophyll concentrations in surface water is a direct measure of phytoplankton abundance. Since phytoplankton is the foundation of the marine food web, chlorophyll data is essentially a map of biological productivity. Where chlorophyll is elevated, baitfish follow. Where baitfish concentrate, predators are close behind.
On satellite chlorophyll maps, green areas indicate high phytoplankton concentration. Blue areas represent clear, open ocean with low biological productivity. The fishing almost never happens in the middle of either zone. The productive water is at the edges, where the green meets the blue. These chlorophyll fronts are hunting zones. Fish use the murky, productive water to ambush prey that moves between the two zones.
The relationship between chlorophyll and fish behavior varies by species. Some gamefish, including many billfish, prefer the clear blue water adjacent to green but rarely enter the bloom itself. Others, like juvenile mahi-mahi, are often found inside or very close to green water where food is most abundant. Understanding what your target species prefers helps you position along the chlorophyll edge correctly.
Chlorophyll data also helps identify productive fishing conditions that SST alone would miss. Two areas with the same surface temperature can have vastly different chlorophyll concentrations, and the one with more biological activity is almost always the better bet. The best offshore forecasts always overlay SST and chlorophyll together, using both to triangulate on the most productive zone.
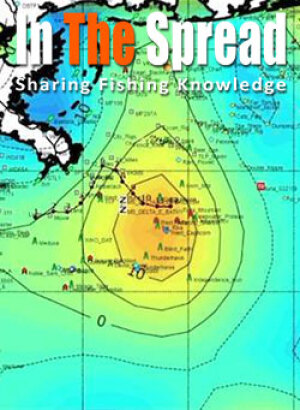
How Altimetry Data Reveals What Temperature Maps Cannot
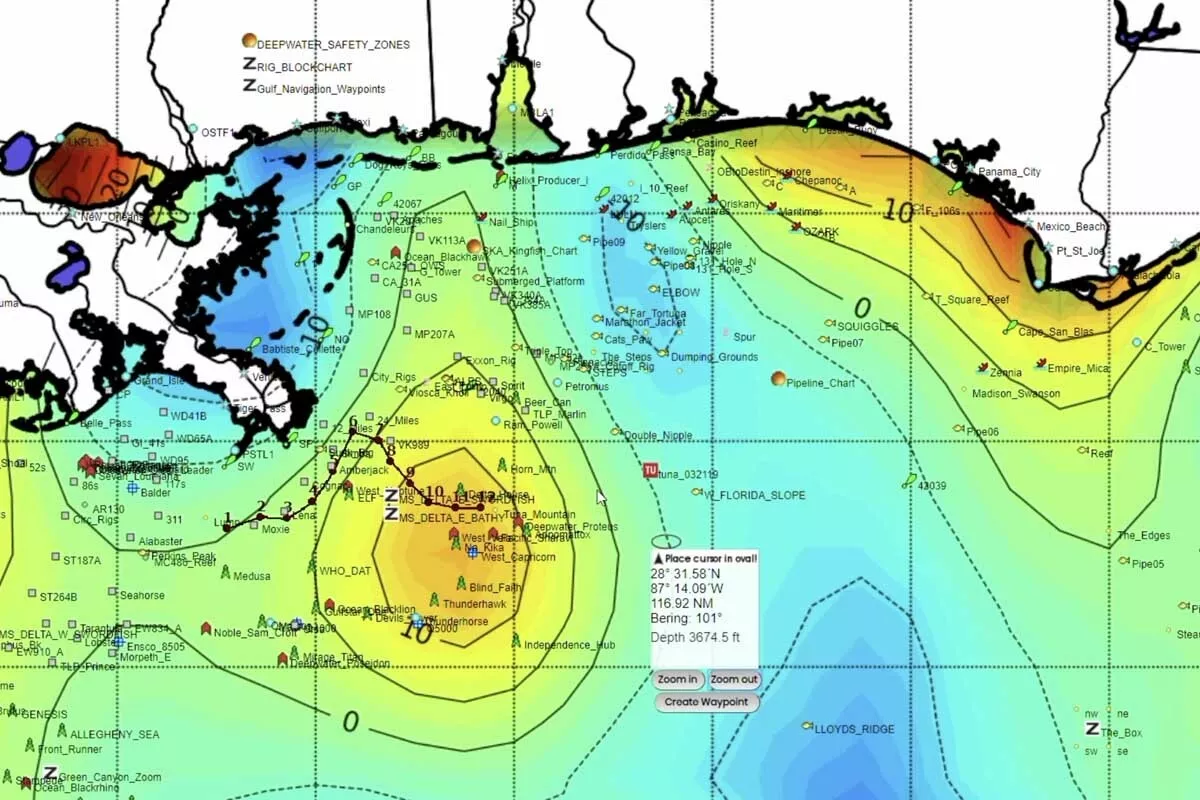
Altimetry data measures variations in sea surface height and is the most technically sophisticated data layer available to recreational anglers. It reveals what SST and chlorophyll charts cannot: the subsurface structure of the ocean, including eddies, upwellings, downwellings, and current convergences that shape where fish stack.
Eddies are circular current systems that spin off from major ocean currents like the Gulf Stream. They create self-contained ecosystems that can persist for weeks or months. Warm-core eddies, which appear as elevated areas on altimetry charts, spin clockwise in the Northern Hemisphere and hold different temperature and productivity characteristics than cold-core eddies, which spin counterclockwise and often drive upwelling along their edges. These eddy edges are among the most productive offshore fishing zones available, and you cannot find them with SST data alone.
- Areas of depressed sea surface height often indicate upwelling, where nutrient-rich water rises and biological activity is elevated.
- The boundaries between elevated and depressed areas mark current convergence zones where baitfish concentrate.
- Treat the core of a strong warm-core eddy as generally less productive. You are hunting the outer 10 to 30 percent of the eddy, especially where that edge intersects with a temperature or chlorophyll front.
- Stable eddies that have persisted for multiple days are more reliable targets than newly forming features.
- Altimetry works best combined with SST and chlorophyll. A depressed SSH zone with elevated chlorophyll and an identifiable temperature break is a high-confidence target.
One important caveat: most altimetry data available through fishing platforms carries a 24 to 72-hour processing lag. You are looking at a recent snapshot of persistent features, not a live feed. Hunt large, stable features and do not chase small variations that may not represent fishable conditions.
Moon Phase, Solunar Theory, and When Fish Feed
The gravitational influence of the moon and sun on tidal movement is measurable science. The extension of that influence to fish feeding behavior, known as solunar theory, has a long history of anecdotal support from working captains and guides. Robust controlled experiments are limited, however, and the scientific evidence for direct lunar effects on feeding rates, separate from the tidal mechanics the moon drives, remains mixed. Treat solunar periods as a useful timing overlay built on celestial mechanics, not as hard-validated science.
In practical terms, most experienced anglers treat solunar periods as a timing layer rather than a primary forecasting variable. A major solunar period during a falling tide with an active front moving through is not going to overcome the suppressant effect of rapidly dropping barometric pressure. But on a day when conditions are otherwise neutral, aligning your time on the water with a major period can make a meaningful difference.
The solunar period framework produces two major periods and two minor periods each day. Major periods, which typically last about two hours, occur when the moon is directly overhead or directly underfoot. Minor periods occur at moonrise and moonset. The most consistently productive windows across species and environments are the major periods that coincide with moving tides during a stable or rising barometer.
Bottom Structure: The Permanent Variables in Your Forecast
Oceanographic conditions change daily. Structure does not. Reefs, ledges, seamounts, wrecks, canyon walls, and hard-bottom transitions are permanent features that hold fish across seasons. When favorable water conditions intersect with productive structure, you have a high-confidence fishing location.
The interaction between current and structure drives upwelling at a local scale. When ocean current encounters a seamount or canyon wall, it deflects upward, pulling nutrient-rich water toward the surface. This localized upwelling concentrates the food chain over a specific piece of bottom that you can return to trip after trip. The reason experienced offshore captains run to the same canyon or seamount year after year is not habit. It is because the physics that makes that spot productive is built into the geography.
Tools to Understand for Building Fishing Forecasts
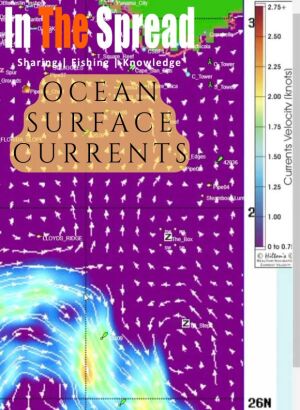
Ocean surface currents concentrate baitfish and gamefish in predictable zones revealed through satellite image analysis. Understanding arrow patterns for current direction and speed, identifying upwelling and downwelling zones where vertical movement affects prey, and recognizing warm core eddies that trap bait transforms random offshore searching into informed decisions about where conditions align to create prime fishing locations.
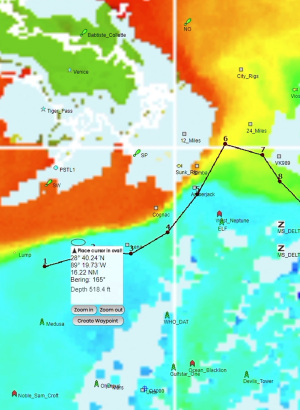
Moderate chlorophyll concentrations outperform both extremely low and extremely high levels for pelagic fishing because very dense blooms sometimes create conditions predators avoid. Tom Hilton explains interpreting color gradients from blues indicating barren water through greens and yellows showing productive zones, and why combining chlorophyll with temperature and current data identifies where complete food chains support apex predators.
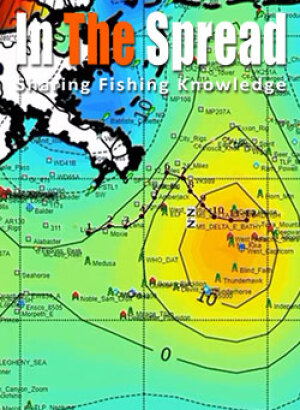
Temperature and chlorophyll satellites show surface conditions but miss the vertical water movements driving productivity. Tom Hilton explains how altimetry reveals upwelling bringing nutrients from depth versus downwelling pulling them away, why upwelling edges outperform centers for predator positioning, and what sea surface height variations indicate about food chain sustainability.
Offshore anglers running without satellite data waste fuel searching randomly for oceanographic features that satellite imagery reveals precisely. Thomas Hilton explains what sea surface temperature breaks, chlorophyll concentrations, and altimetry show about fish positioning, how combining multiple data layers identifies high-probability zones, and why real-time updates matter when features shift daily.
Debate over salinity chart utility stems from satellite showing only surface conditions while many species position at depth. Learn what purple to maroon color transitions reveal about freshwater and saltwater mixing zones, why king mackerel concentrate along these gradients, and when nearshore applications work better than offshore tuna scenarios.
Blue marlin preferring 78 to 88 degrees differs from wahoo favoring cooler break edges, making species-specific SST interpretation critical. Learn identifying temperature gradients where water masses collide, why breaks without chlorophyll may hold no fish despite perfect temps, and how daily shifts mean yesterday's productive water may be miles from current locations.
Offshore Fishing Forecasts: Putting the Data Layers Together
Offshore forecast-building is where all the data layers described above converge into a decision. The sequence matters because each layer either confirms or disqualifies the previous one.
Start with the weather window. A productive oceanographic setup means nothing if sea conditions make running unsafe or fishing impractical. Check marine forecasts at least 48 hours out and monitor for changes. Wind direction shift and building sea state are the first factors that override everything else.
Once you have a viable weather window, pull your SST data and identify the location of temperature breaks within your range. Note which breaks have held their position for two or more days. Overlaying chlorophyll data onto the SST chart shows you which breaks have biological activity behind them, not just a temperature differential. A break with elevated chlorophyll on the productive side is a significantly better target than a clean temperature break in biologically dead water.
Add the altimetry layer to identify which oceanographic features are driving those breaks. A temperature break associated with a persistent eddy edge is a stable, high-value target. Add bathymetric data to check whether bottom structure underlies any of these features. The intersection of a temperature break, elevated chlorophyll, an identifiable altimetry feature, and a productive bottom contour is the highest-confidence target offshore fishing produces.
Keep in mind that eddies and temperature breaks typically drift several miles per day. Use two- to three-day composite charts and any motion arrows your platform provides to project where a feature will be when you actually arrive, not just where it sat yesterday. When heavy cloud cover obscures SST or chlorophyll imagery, lean harder on altimetry and bathymetry. Those layers are not affected by cloud contamination and give you a structural framework even when the surface picture is incomplete.
Time your departure to arrive at your target area during the peak tidal or current flow window, ideally aligned with a major solunar period if possible. The goal is to be fishing during maximum current when you are positioned on a high-confidence target based on oceanographic data.
Inshore Saltwater Forecasts: A Different Set of Variables
Inshore fishing forecasts use many of the same variables as offshore forecasting but weight them differently. SST and altimetry matter far less in a tidal bay or coastal flat than they do 50 miles offshore. What drives inshore fishing is the interaction between tidal movement, wind, water temperature, and structure at a localized scale.
Wind direction has an outsized effect on inshore environments. An onshore wind pushes warmer surface water and baitfish toward the shoreline, concentrating fish along beaches, points, and shallow structure. An offshore wind reverses that, pulling water away from the coast and sometimes triggering localized upwellings in nearshore zones. For anglers working flats and shallow backwaters, wind direction can determine whether a flat is productive or completely empty on a given day.
Seasonal water temperature patterns matter more in inshore environments because temperature fluctuates more dramatically in shallow water. A cold front that drops water temperature by four degrees on a shallow flat can shut down species like snook or seatrout almost immediately, shifting them off the flat entirely into deeper refuge water. Tracking water temperature trends, not just current readings, helps you anticipate these movements before they happen.
The combination of tidal phase, wind direction, and barometric trend is the inshore angler's equivalent of the offshore data stack. When those three factors align favorably, you typically find fish on predictable structure and shallow feeding areas. When they conflict, you need to read the water on arrival and adjust rather than commit to a location before you launch.
Freshwater Fishing Forecasts: What Changes and What Stays the Same
Freshwater forecasting shares a structural foundation with inshore saltwater forecasting but operates in a more compressed, reactive environment. Lakes and rivers respond to weather changes faster than coastal systems because there is less thermal mass to buffer temperature swings. A cold front that might delay inshore saltwater fishing by a day can shut down a reservoir or river almost immediately.
Water temperature is the dominant variable in freshwater forecast-building. Species like bass, walleye, and muskie have distinct seasonal patterns tied to temperature windows, and understanding where a given body of water sits in its seasonal temperature arc tells you more about fish location and behavior than almost any other factor. Spring warming triggers pre-spawn movements that position fish on predictable structure. Summer stratification creates thermoclines in deeper lakes that concentrate fish at specific depths. Fall turnover, when surface and deep water mix as temperatures equalize, temporarily disrupts patterns before fish reset for winter.
Barometric pressure affects freshwater fish much the same way it affects saltwater species. Falling pressure ahead of a front tends to trigger feeding in freshwater environments, particularly for species like bass and pike that respond strongly to pressure change. This is one of the reasons that fishing in the hours immediately before a storm front often produces some of the best freshwater action of the season.
River and stream anglers add current and water level to their forecast equation. Water level data from USGS stream gauges provides real-time information on flow rates that affects fish positioning dramatically. Rising water after rainfall typically improves fishing by washing food into the system and activating fish that were holding tight in low-flow conditions. Falling water tends to push fish toward deeper, more stable habitat. Rapidly falling water can shut down activity completely.
For freshwater bass, muskie, and other structure-oriented species, seasonal structural patterns provide the framework that weather and environmental data fills in. Knowing where fish should be based on season and water temperature allows you to prioritize your time on productive structure rather than searching.
Advanced Forecasting: Multi-Day Trends and Fishing Logs
Single-day data snapshots are useful. Multi-day trend analysis is where advanced anglers gain a consistent edge.
The direction and rate of change in any environmental variable usually predicts fishing behavior better than the absolute value. Rising water temperature, even when it is still below optimal, typically produces better fishing than stable warm water. A barometer climbing steadily after a front passage often produces better action than a high-pressure system that has sat over the area for four days. Trend is signal. Stability is background.
Keeping a detailed fishing log is the single highest-return habit a serious angler can develop. Recording catches alongside the environmental conditions present on each trip, water temperature, barometric pressure, tidal phase, wind direction, time of day, and bottom structure, builds a personal dataset specific to your home waters. After two seasons of consistent logging, patterns emerge that no satellite service can provide because they are calibrated to your exact fishing area and target species.
Cross-referencing your log against seasonal conditions also reveals the outlier days, the periods when fish were highly active despite apparently poor conditions or completely absent despite ideal ones. Understanding those anomalies, usually explained by factors like bait migration timing, spawning pressure, or unseen current shifts, deepens your ability to read a water body and adjust a forecast in real time when on-the-water observations contradict the data.
When to Move: Feature Drift and On-Water Overrides
Even the best offshore forecast has a shelf life. A temperature break or eddy edge identified on yesterday's chart may have shifted several miles by the time you arrive. Most satellite altimetry carries a 24- to 72-hour processing lag, and even the freshest SST composites do not show you what happened overnight. Eddies and persistent current features typically drift three to ten miles per day depending on current strength and the season.
This means your chart is a predictive tool, not a live feed. When building your plan, project forward from the most recent data using your platform's motion arrows or by comparing sequential daily images. Think about where the feature will be when you arrive, not where it was when the satellite passed.
Frequently Asked Questions About Fishing Forecasts
What is the most important factor in a fishing forecast?
There is no single most important factor. Barometric pressure trend, tidal movement, and water temperature are the three variables that consistently have the most influence on fish behavior across the widest range of species and environments. The interaction between them, not any individual factor, drives feeding behavior.
How do I read a sea surface temperature chart for fishing?
Look for temperature breaks, areas where water temperature changes sharply over a short distance. These boundaries concentrate baitfish and are where predators hunt. Target the edge of the break, not the warmest water. Breaks that have held their position for two or more days are more reliable than newly formed ones.
What does barometric pressure have to do with fishing?
Fish sense atmospheric pressure changes through their swim bladders and lateral line systems. A falling barometer ahead of an approaching front often triggers aggressive feeding. High, stable pressure tends to produce slower fishing. The rate of pressure change over a 24-hour window is more predictive than the absolute pressure reading. Controlled lab experiments on some species have found weak direct effects, but multi-year logbooks from guides consistently show catch-rate bumps during falling pressure windows and quieter periods under long-term stable highs. It is real enough to plan around.
Do moon phases really affect fishing?
Moon phase affects tidal range, which directly affects current strength and feeding behavior in tidal environments. The solunar period framework, which predicts feeding windows based on the moon's position, has strong anecdotal support from experienced guides and captains. Major solunar periods overlapping with moving tides during stable or rising barometric pressure are considered the most reliable feeding windows available.
What is altimetry data and why does it matter for offshore fishing?
Altimetry measures variations in sea surface height to reveal eddies, upwellings, and current convergences that temperature and chlorophyll charts do not show. Eddy edges and upwelling zones identified through altimetry are among the most productive offshore fishing locations available. Combining altimetry with SST and chlorophyll data gives you a three-dimensional picture of oceanographic conditions that no single data layer can provide alone.
What satellite fishing apps are best for offshore fishing?
Hilton's Realtime Navigator, RipCharts, and FishTrack are the three most widely used platforms among serious offshore anglers. SatFish offers excellent image quality and bathymetric integration. BigBlue is strong for broad offshore surveys. The right platform depends on your primary fishing region, the species you target, and whether you prioritize predictive modeling or real-time data quality. Regional coverage and data latency also vary across services; some platforms update SST composites more frequently than others, and altimetry lag can differ meaningfully between providers. The ITS article comparing offshore satellite fishing apps and platforms covers those differences in detail.
How do I know when to adjust my forecast while on the water?
On-water observations always take precedence over pre-trip data. Bait behavior, water color, slick lines, current direction, and bird activity all provide real-time information that satellite data cannot. If the data pointed you to a location and nothing is indicating life when you arrive, trust what you see and move. A fishing forecast is a probability tool, not a guarantee.
Putting It All Together Before You Launch
The most useful thing a fishing forecast does is give you a decision framework before you spend fuel. It narrows the probability window from the entire ocean to a set of specific, defensible targets. That is its job.
The sequence that most experienced offshore captains follow looks something like this: start with the weather window, confirm viable conditions. Pull SST and chlorophyll data together and identify temperature breaks with biological activity behind them. Add altimetry to understand the oceanographic drivers of those breaks. Cross-reference against bottom structure where available. Check tidal and solunar timing and plan your departure to arrive on target during the optimal current window. Then stay flexible when you get there.
No forecast guarantees fish. What it does is replace guesswork with informed probability, and over a season, that shift in approach compounds into significantly better results. The anglers who consistently put fish in the box are not luckier than everyone else. They are more prepared, and their preparation starts the night before at the computer, not at the launch ramp in the morning.
Login
to leave a review.
User Reviews
There are no reviews yet.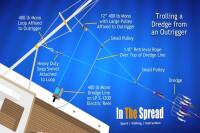
Complete Dredge Pulley Setup Guide
Saltwater
12.28.2020
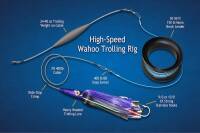
High Speed Wahoo Trolling Rig
Saltwater
09.08.2018
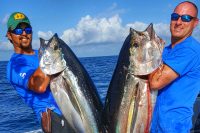
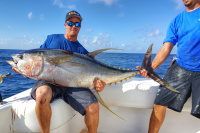
Fishing Light Tackle for Yellowfin Tuna
Saltwater
09.08.2018

Fishing Gulf of Mexico Inshore Waters
Saltwater
11.28.2023
0