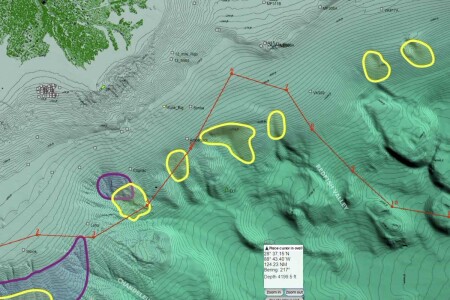
When current hits offshore structure, cold nutrient-rich water rises toward the surface. That localized upwelling compresses bait and predators into defined zones. This article breaks down which structures create the strongest upwelling, how to read the signs before and during a trip, and how to position and present baits where predators actually feed.
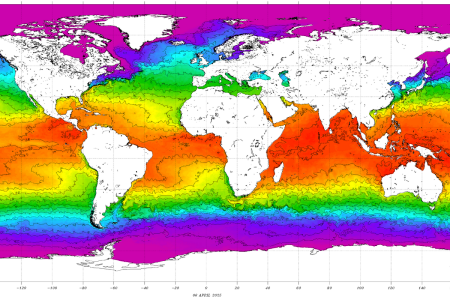
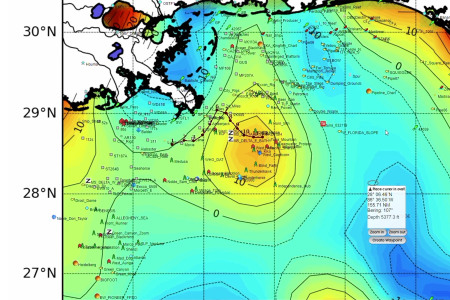
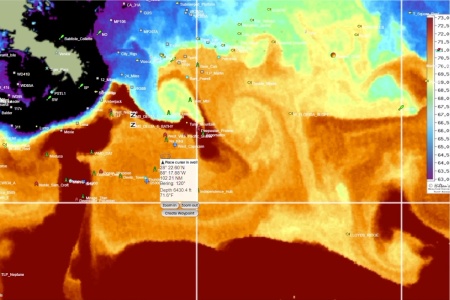
Sea surface temperature charts show you the ocean's thermal structure before you run a mile. Learn to identify the breaks, eddies, and upwellings that concentrate baitfish and pelagic predators, match those features to species-specific temperature ranges, and layer in chlorophyll and altimetry data to build a high-confidence plan the night before your trip.
A productive fishing forecast pulls from satellite oceanography, tidal data, barometric pressure, and celestial timing. Each data layer narrows the probability of where fish will be and when they will feed. This article breaks down what each variable tells you, how the layers work together, and how experienced anglers translate data into decisions before they leave the dock.
Satellite oceanographic data has changed how serious anglers plan offshore trips. This breakdown of SatFish, RipCharts, FishTrack, and BigBlue covers what each app does best, who it suits, and what the data actually tells you before you run.
Five satellite fishing services compete for the same angler, but they are not selling the same thing. This breakdown covers what separates ROFFS, SiriusXM Marine, Hilton's Realtime Navigator, SatFish, and RipCharts on the variables that actually matter: update frequency, data layers, expert interpretation, offline access, and price.
Satellite fishing maps give offshore anglers a real-time picture of ocean conditions before leaving the dock. Learning to read SST charts, chlorophyll data, altimetry, and current edges, and knowing how to layer them together, is one of the highest-leverage pre-trip skills a serious offshore angler can develop.
The barometer on your phone is one of the most underused fishing tools available. Pressure trends tell you when fish are likely to feed, how deep they will be holding, and whether the bite is about to turn on or shut down. Here is how to read those trends and put them to work on your next trip.
The solunar calendar gives anglers a structured way to time trips around lunar-driven feeding windows. Aligning major solunar periods with the right tidal stage for your target species shifts the odds measurably in your favor. This article covers the theory, the tidal mechanics, and how to apply both when planning your next trip.
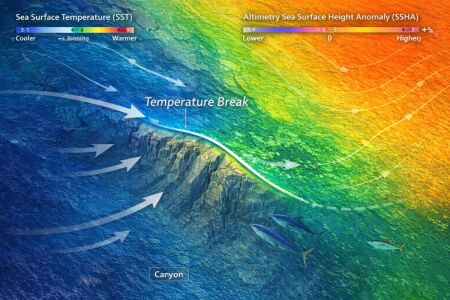
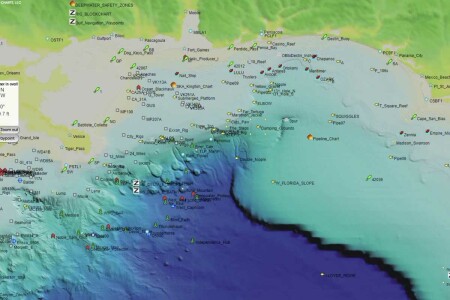
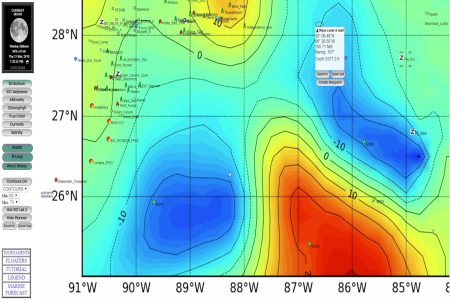
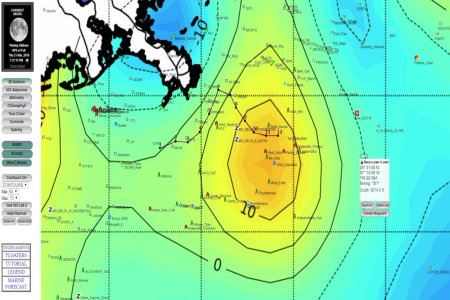
Altimetry maps and ocean upwelling data cut through the guesswork of offshore fishing. Understanding sea surface height anomalies, current fronts, and upwelling zones puts you on tuna, marlin, and other pelagic fish faster and more consistently. This is the science behind where the fish are, and how the best offshore captains locate them before they ever leave the dock.
Sea surface height tells you more about where fish will be than most anglers realize. When you know how to read altimetry data alongside temperature and chlorophyll charts, you stop guessing and start targeting the specific oceanographic features that concentrate baitfish and gamefish offshore.
Sea surface temperature analysis eliminates guesswork in offshore fishing by revealing where target species concentrate along thermal boundaries. Learn to interpret SST charts, identify productive temperature breaks, and position yourself where fish aggregate before competitors arrive.
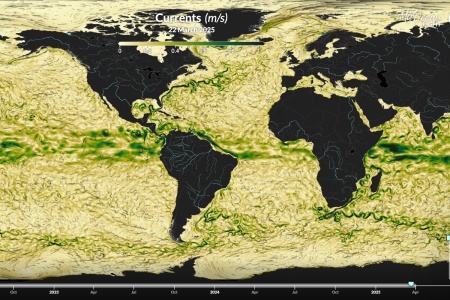
Satellite altimetry technology transforms offshore fishing by revealing underwater current patterns invisible to traditional methods. Anglers using this scientific approach consistently locate productive upwelling zones where game fish concentrate, achieving higher catch rates and significant fuel savings.