Five satellite fishing services compete for the same angler, but they are not selling the same thing. This breakdown covers what separates ROFFS, SiriusXM Marine, Hilton's Realtime Navigator, SatFish, and RipCharts on the variables that actually matter: update frequency, data layers, expert interpretation, offline access, and price.
Comparing Offshore Satellite Fishing Map Services
Choosing the right satellite fishing service is one of the most consequential pre-trip decisions you make for offshore fishing. If you already understand how satellite fishing maps work, including the data layers, the oceanographic logic, and how SST fronts and chlorophyll lines converge to hold fish, the question is no longer whether to use these tools. The question is which service fits your fishing style, your budget, and the decisions you actually make on the water.
This article compares five leading providers: ROFFS, SiriusXM Marine, Hilton's Realtime Navigator, SatFish, and RipCharts. If you are still getting up to speed on the underlying data itself, start with what you need to know about satellite fishing maps before heading offshore, then come back here for the service-by-service breakdown.
What Should You Look for in a Satellite Fishing Map Service?
Before you spend a dollar on any of these services, it helps to think through what you are actually buying, because not all of them are selling the same thing, and the one that looks like the best deal on paper may not be the right match for how you fish.
The first thing most captains ask about is update frequency, and for good reason. When SST fronts shift after a weather system rolls through or the Gulf Stream meanders hard, yesterday's chart can send you in completely the wrong direction. If you fish dynamically and conditions change fast in your home waters, how often a service refreshes its data is often the first filter to apply before anything else.
Right behind that is a distinction most anglers underestimate until they have been burned by it: the difference between expert interpretation and raw satellite imagery. Every service on this list will show you processed satellite data. Only one of them tells you what that data actually means for fishing that day. There is a real difference between looking at an SST chart and reading an oceanographic assessment of where the productive water is and why. Once you understand that difference, the pricing across these services starts to make a lot more sense.
From there, the practical variables are data layers, offline access, coverage, and cost. Not every service provides altimetry or detailed ocean current vectors alongside SST and chlorophyll. If those deeper layers are part of how you build your offshore game plan, you need to know which services actually have them before you subscribe. Offline capability matters once you are running offshore without reliable mobile data; the ability to pull charts and cache them before departure is a real operational advantage. Coverage area determines whether a service even works for your home port. And price, when you factor in how many offshore trips you make per season, looks completely different at 10 days a year versus 40.
How Do These Five Services Compare on Data Layers?
Here is a direct comparison of the core data layers each platform provides. This is the foundation of any honest evaluation, and the differences are more significant than most anglers realize before they commit to a service.
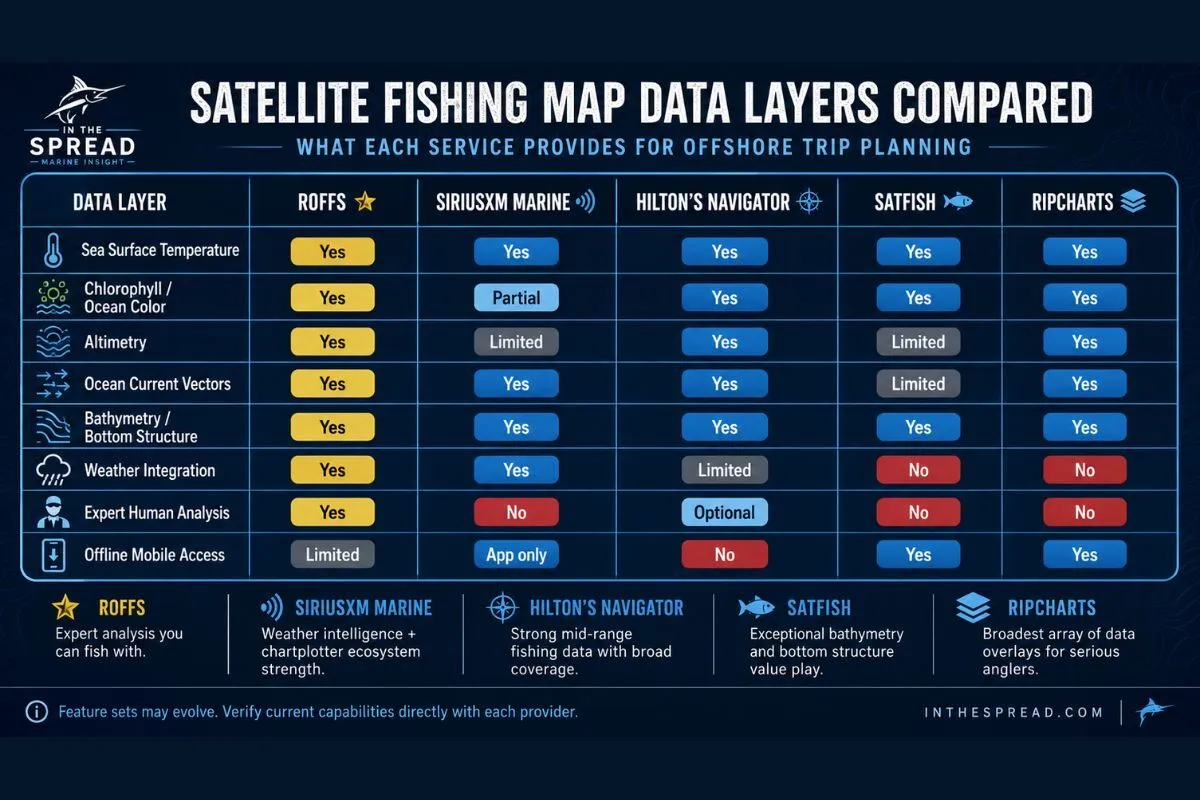
*Weather capabilities on fishing-data-first platforms like SatFish and RipCharts may evolve. Verify current feature sets directly with each provider.
Verify current feature availability directly with each provider before purchasing. This table reflects publicly documented capabilities at time of publication.
Why Does Cloud Cover Matter for Satellite Fishing Data?
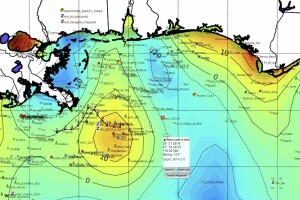
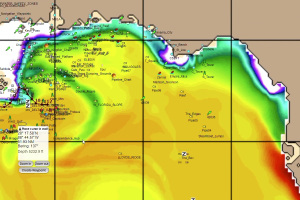
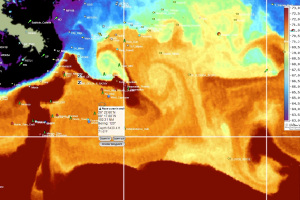
One variable that affects every service on this list is cloud cover. The satellite sensors used to measure SST and chlorophyll operate in optical and thermal infrared bands, which means heavy or persistent cloud cover over your target area can block data collection entirely. After a multi-day weather system, you may open your charts and find patchy or missing data exactly where you need it most. That is another reason update frequency matters: more frequent satellite passes increase the odds of capturing a usable window between cloud events. If you are planning a trip immediately after a front moves through, factor in the possibility that your charts may be incomplete until the skies clear.
How Do Anglers Access and Use Each Service?
Data layers tell you what a service provides. This table tells you how you actually interact with it: on your phone, at your helm, or both.
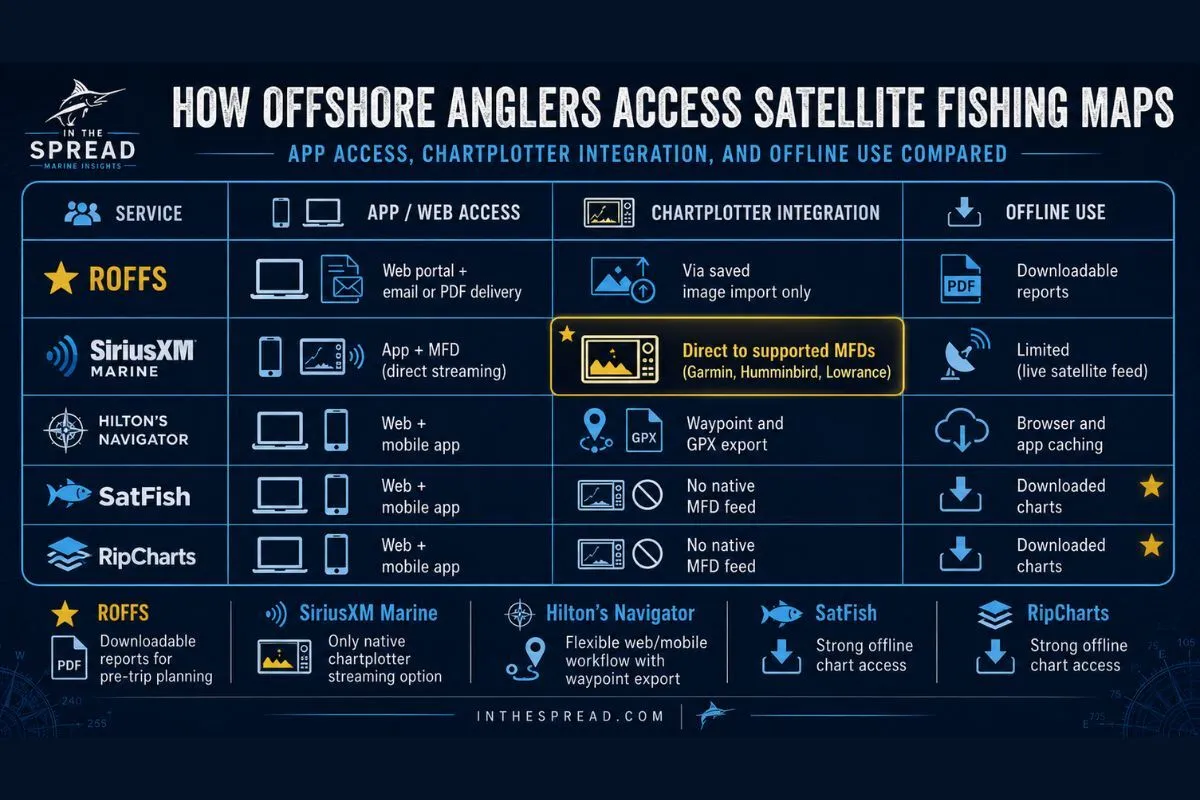
The chartplotter integration column is where SiriusXM separates itself from every other service in this comparison. If having fishing and weather data stream directly to your helm display matters to your operation, it is the only option that delivers it natively.
Is ROFFS Worth the Cost for Serious Offshore Anglers?
ROFFS (Roffer's Ocean Fishing Forecasting Service) is in a category of its own, and the reason comes down to one thing: you are not buying a map. You are buying an analysis. Mitchell Roffer's team employs oceanographers who work through 20-plus environmental variables and produce a customized fishing forecast with specific hotspot indicators for your target area. When you open a ROFFS analysis, you are reading a professional interpretation of SST, chlorophyll, altimetry, current boundaries, and historical fish movement data, synthesized into actionable intelligence for where you are fishing that day.
That distinction matters most in water where conditions shift fast and the margin for error on a long run is expensive. For captains working dynamic, current-driven water where a misread front or a stale altimetry picture translates directly into an 80-mile run in the wrong direction, having a human oceanographic read rather than raw imagery is a decision tool with a clear return.
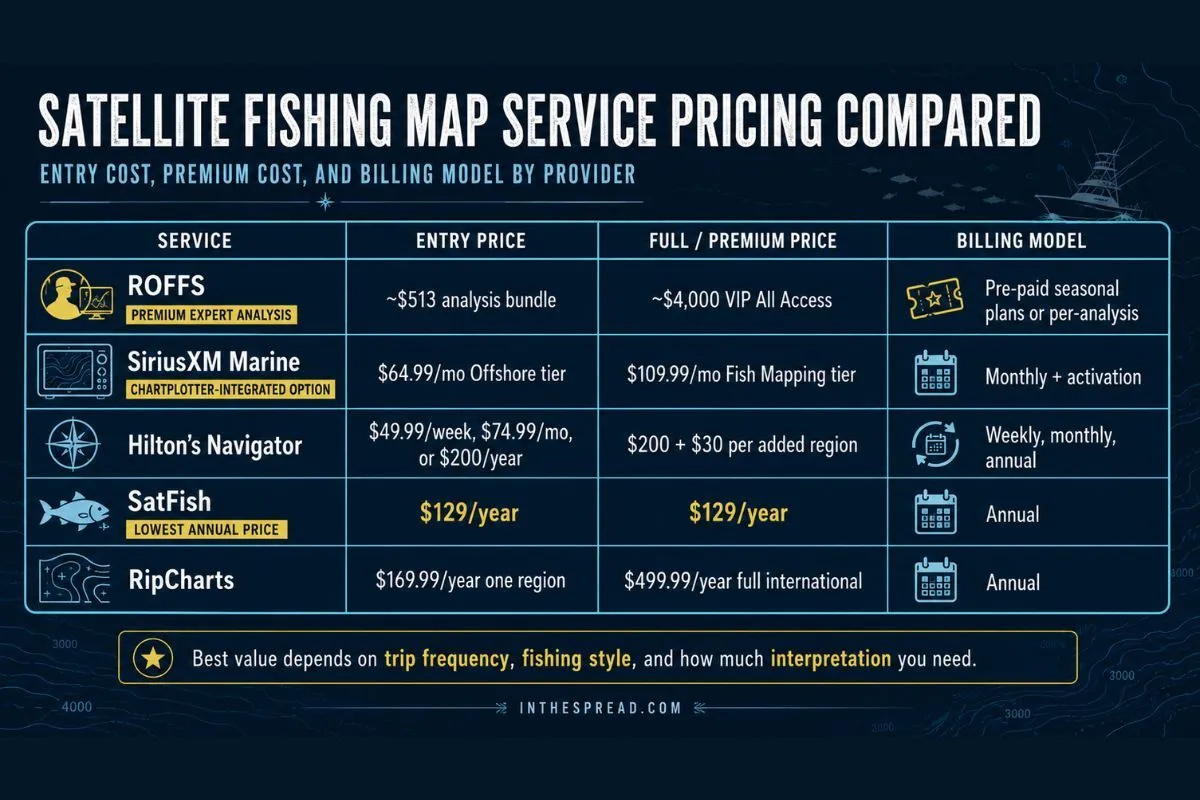
ROFFS pricing is built around a Woo Credits system rather than a flat monthly or annual subscription. You purchase fishing analyses individually or through Pre-Paid Seasonal Plans that load your account with credits to spend throughout the calendar year. Seasonal plan options range from approximately $513 for smaller analysis bundles up to approximately $2,268 for larger packages. Pre-season discounts have historically offered savings of up to 56 percent compared to full per-analysis rates when you commit before a seasonal cutoff date. For high-frequency offshore anglers and tournament captains, VIP Plans run approximately $3,000 annually and cover every analysis run in one selected geographic area plus a fixed number of any-area analyses across other ROFFS zones. The VIP All Access option, spanning multiple offshore regions including the Atlantic and Gulf of Mexico, runs approximately $4,000, with all credits expiring December 31 of the purchase year.
What Does SiriusXM Marine Offer Offshore Fishing Captains?
SiriusXM Marine approaches this market from a fundamentally different angle than its competitors, and understanding that angle will tell you quickly whether it is the right service for you. Weather integration is the core product. Fishing intelligence is layered on top. For captains who want both functions in one system, particularly one that feeds directly into compatible chartplotters from Garmin, Humminbird, and Lowrance. SiriusXM is the only service in this comparison that delivers seamless onboard electronics integration.
The relevant tier for serious offshore fishing is the Fish Mapping plan at $109.99 per month, plus a $25 one-time activation fee. This covers SST fronts, ocean currents, high-resolution structure mapping with 25-foot bottom contours, historical fishing data, routing tools, and full weather integration including radar, lightning, wind, and wave forecasting up to 48 hours out. The Fish Mapping App supports pre-trip planning from shore while weather and SST data stream to compatible chartplotters while you are running. The Offshore plan at $64.99 per month covers SST and weather without the full Fish Mapping feature set. The Coastal and Inland tiers are not relevant to offshore fishing applications.
SiriusXM Marine's weather and fishing services are delivered via satellite throughout its coverage footprint, which extends well offshore of the US coastline. Many boaters use a practical benchmark of roughly 150 nautical miles as a common operational reference for blue water applications, though actual coverage varies by location within the satellite footprint. If you regularly fish distant offshore grounds, verify your specific region using SiriusXM's official coverage map before subscribing.
How Does Hilton's Realtime Navigator Compare to Other Mid-Range Services?
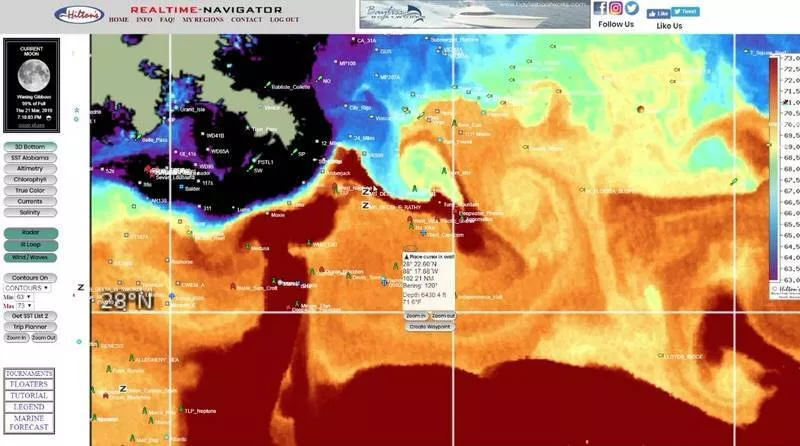
Hilton's Realtime Navigator has earned a strong following for one straightforward reason: it is a purpose-built fishing data platform that does not require a background in oceanography to use effectively. Thomas Hilton's service delivers real-time SST, chlorophyll, altimetry, and current data in an interface designed for the way captains actually think about trip planning. That accessibility matters more than most people give it credit for, especially when you are trying to make quick, confident decisions before a tide window closes.
Worth knowing for captains who want the best of both worlds: as of 2026, ROFFS analyses can be accessed directly inside Hilton's Realtime Navigator via an additional annual charge. That integration gives some captains the option to combine Hilton's familiar, angler-friendly interface with ROFFS' expert oceanographic interpretation in a single workflow. That is a meaningful option if you want analytical depth without completely rebuilding how you read charts.
In The Spread carries dedicated instructional video content built specifically around reading and applying Hilton's Navigator data offshore. The Hilton's Offshore Satellite Fishing Maps page and the Hilton's Realtime Navigator fishing forecast courses show you exactly how working captains pull intelligence from the Navigator interface and translate oceanographic data into specific fishing decisions. If you are building your satellite interpretation skills alongside your subscription, that instructional content is a genuine competitive advantage that no other service on this list can match.
Is SatFish a Good Value for Recreational Offshore Anglers?
SatFish built its reputation on two things: imagery quality and bathymetric detail. At $129 per year, it is the most affordable service in this comparison, and within that price point it delivers genuinely strong visual clarity and bottom structure mapping that competes well above its cost tier.
The HD satellite imagery is noticeably cleaner than what some competing platforms offer at similar price points. The bathymetric mapping, including bottom contours, structural relief, and depth detail, is among the strongest available in the value category, which makes SatFish particularly useful for anglers whose fishing decisions are driven by structure rather than open-water current and eddy analysis. The offline mobile functionality is a practical field advantage: download your charts before leaving port and access them on the water without burning mobile data or depending on connectivity.
North Carolina captain Mike Dupree, who teaches offshore planer fishing and slow trolling techniques through In The Spread, relies on SatFish for his offshore work out of North Carolina. Dupree's fishing is anchored to temperature breaks, bottom structure, and the kind of detailed bathymetric reading that tells you where concentrations of fish are holding along the shelf edge. That is exactly the data set where SatFish performs at the top of its class.
What Does RipCharts Offer That Other Value-Tier Services Don't?
RipCharts competes in the value tier on update frequency, and that single differentiator makes it the right fit for a specific kind of angler. Standard plans deliver multiple daily SST updates; premium tiers offer up to 8 to 20 SST updates per day depending on region and conditions. For tournament fishing or highly dynamic ocean conditions where the water can move significantly between morning and afternoon, that refresh rate is not a spec on paper. It is a decision advantage on the water.
RipCharts pricing starts at $169.99 per year for a single US coastal region. Multi-zone packages covering combinations like the East Coast and Baja run $229.99 annually. Full international coverage packages, such as the complete Australian coast, run up to $499.99. The mobile app is free to download, but all features require a paying subscription. The platform covers SST, chlorophyll, ocean currents, altimetry, and bathymetry, and the data overlay system, which stacks multiple layers simultaneously on a single chart view, is one of the most practically useful features for experienced satellite map readers who want maximum data density visible at once. Offline mobile access is included on applicable plans.
For tournament anglers who need the highest update frequency available below the ROFFS price point, RipCharts at $169.99 per year for a single region is the strongest value-tier option. Anglers who fish multiple coastal regions and want cost-effective multi-zone access will find the combined packages cover meaningful ground. And for captains who have developed their satellite reading skills and want the most comprehensive overlay options outside of a premium service, the RipCharts feature set is genuinely deep for the annual cost.
In The Spread satellite fishing maps video course

How Much Does Each Satellite Fishing Service Cost?
Pricing is often the deciding variable, so here is a direct summary across all five services. The cost picture looks very different when you factor in actual trip frequency. A captain running 40 offshore trips per season amortizes a ROFFS VIP plan to roughly $75 per trip. A recreational angler running 10 offshore days per year spreads SatFish's $129 annual cost across the whole season for under $13 per outing.
All pricing reflects publicly available rates at time of publication. Rates are subject to change. Confirm current pricing directly with each provider before purchasing.
Which Satellite Fishing Map Service Should You Choose?
The right service is the one that matches how you actually fish, not the one with the most features listed on a comparison page.
If you are running a charter boat or fishing tournaments where your results matter financially, ROFFS is the defensible investment. The cost is real, but so is the cost of burning several hundred dollars in fuel chasing stale or misread data. The more offshore days you run per season, the better the bundle plan economics become. Charter captains and serious tournament anglers who have made the switch to ROFFS will tell you the service pays for itself in misfires avoided.
If you want weather safety and fishing intelligence in one system that integrates directly with your chartplotter, SiriusXM Marine's Fish Mapping plan is the only option in this comparison that delivers that. The monthly cost adds up, but it replaces what many captains were paying separately for weather data and fishing data on two different platforms. The convenience of having both functions stream to your helm display is a genuine operational upgrade.
If you want solid real-time satellite fishing data at a reasonable annual price and you want the instructional support to develop your reading skills alongside your subscription, Hilton's Realtime Navigator is the strongest mid-range choice. The ITS video content built specifically around the Navigator platform adds a layer of practical value that no other service here can offer. And if you want to step up to ROFFS-level analysis without switching platforms entirely, the Hilton's and ROFFS integration gives you a path to do that.
If budget is the primary constraint and you fish structure-heavy offshore grounds where bottom mapping is as critical as SST, SatFish at $129 per year is a legitimate tool. Captain Mike Dupree uses it for exactly that: reading temperature breaks and bathymetric structure along the North Carolina shelf edge, which is as demanding an offshore environment as you will find on the East Coast.
If you fish tournaments and need high update frequency without the ROFFS price commitment, RipCharts at $169.99 per year for a single region gives you the most data refreshes in the value tier along with a complete overlay system. Many serious captains end up running two services: a value or mid-range platform for daily reference and ROFFS for major tournament weeks or the most critical fishing windows of the season. That layered approach is common among professionals who understand what each platform does best and where each one has limits.
Frequently Asked Questions About Offshore Satellite Fishing Services
What is the best satellite fishing service for offshore fishing?
There is no single best service for all anglers. ROFFS is the strongest choice for professional charter captains and tournament competitors who need expert oceanographic analysis. SiriusXM Marine is best for anglers who want weather and fishing data integrated with their chartplotter. Hilton's Realtime Navigator is the strongest mid-range option for serious recreational anglers building their satellite interpretation skills. SatFish is best for budget-conscious anglers prioritizing bathymetric detail and offline access. RipCharts is best for tournament anglers who need high update frequency at a value-tier price.
Is ROFFS worth the cost for recreational anglers?
For captains running 20 or more offshore trips per season, ROFFS is generally worth the investment. The cost-per-analysis drops significantly on bundle plans, and the expert interpretation prevents the time and fuel losses that cost far more than the subscription fee. For anglers fishing fewer than 10 offshore days per year, the entry cost is harder to justify relative to value-tier alternatives.
How often do satellite fishing map services update their data?
Update frequency varies by service. ROFFS analyses are produced using the most recent satellite and oceanographic data available, with new, time-stamped analyses issued as conditions and satellite passes allow during the season. RipCharts premium tiers offer up to 8 to 20 SST updates per day depending on region and conditions. SiriusXM Marine updates weather data continuously and fishing layers on periodic schedules. Hilton's Navigator and SatFish update on daily or near-daily cycles depending on satellite pass timing and cloud cover over the target area.
What is the difference between ROFFS and RipCharts?
ROFFS provides expert human oceanographic analysis with customized hotspot forecasts. You are paying for interpretation layered on top of the data, not just processed imagery. RipCharts delivers processed satellite imagery with high update frequency across multiple data layers. RipCharts costs approximately $170 per year for a single region; ROFFS plans range from roughly $513 to $4,000 annually. The two services serve fundamentally different levels of analytical sophistication and operational need.
Can I use satellite fishing maps offline when running offshore?
SatFish and RipCharts both offer offline mobile functionality for charts downloaded before your trip. SiriusXM's Fish Mapping App requires connectivity for most features. ROFFS analyses are delivered as downloadable files and can be saved for offline reference. Hilton's Navigator offline capability varies depending on your access method and device.
What data does a satellite fishing map show?
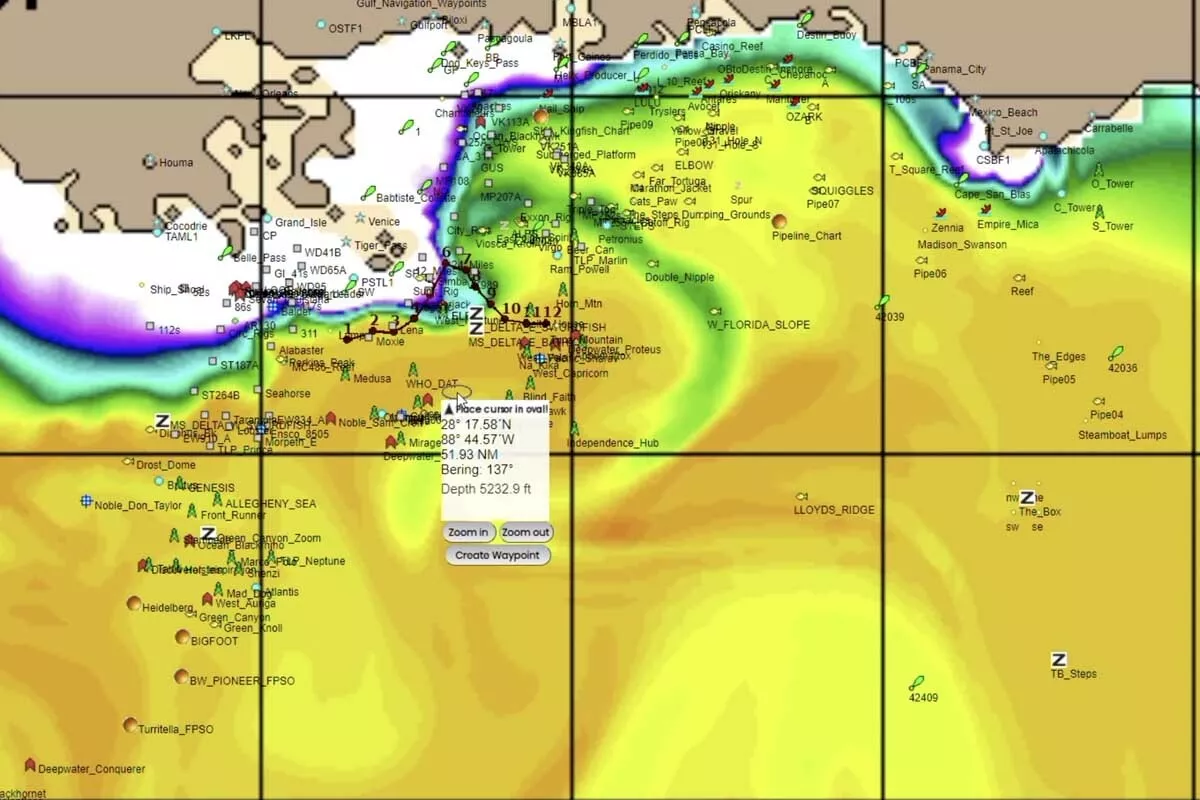
Most satellite fishing services display some combination of sea surface temperature, chlorophyll or derived ocean color data, altimetry, ocean current direction and speed, and bathymetric charts showing bottom depth and structure. Premium services like ROFFS layer expert oceanographic interpretation on top of this data to identify specific productive areas and explain the reasoning behind them.
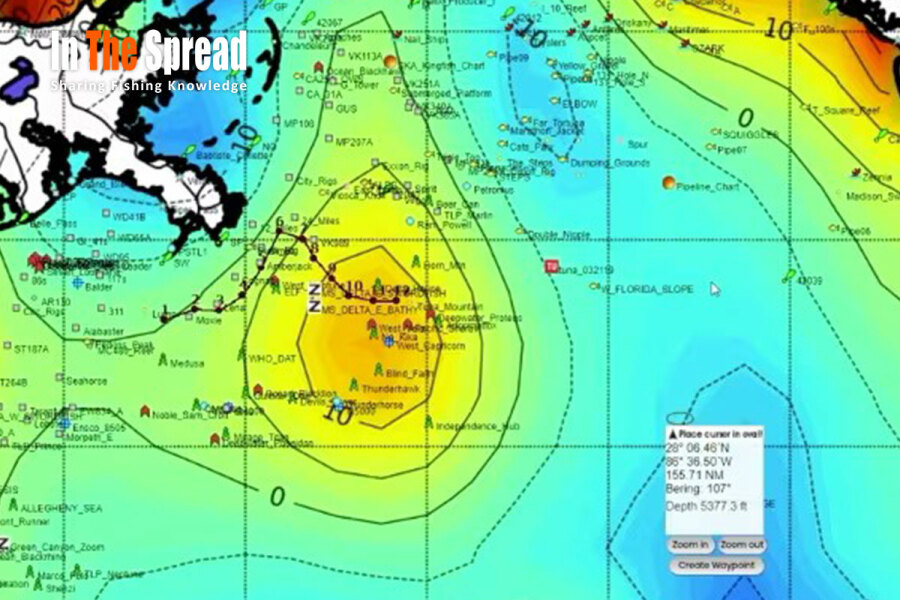
What is the difference between altimetry and SST on a fishing map?
SST shows surface water temperature and identifies thermal breaks, edges, and fronts where baitfish and gamefish concentrate. Altimetry measures sea surface height and reveals subsurface oceanic features like eddies, gyres, and current boundaries that may not appear in SST data alone. Using both layers together provides a more complete picture of where productive water is moving and what is happening beneath the surface.
How far offshore does SiriusXM Marine work?
SiriusXM Marine's fishing and weather services are delivered via satellite throughout its coverage footprint, which extends well offshore of the US coastline. The service is commonly described as reaching about 150 nautical miles from the coast as a practical operational benchmark, though actual coverage depends on your location within the satellite footprint. Check SiriusXM's official coverage map for your specific region before subscribing.
How Do You Turn Satellite Data Into Fishing Results?
Satellite fishing data has shifted from a competitive edge to a standard operating tool for serious offshore captains. The services compared here span a wide range of cost, analytical depth, and real-world application, and none of them is the right answer for every angler. The best choice is the one that fits how you actually make decisions on the water.
ROFFS remains the premium standard when analytical accuracy matters most. SiriusXM Marine is the practical choice when chartplotter integration and weather data are the priority. Hilton's Realtime Navigator holds the mid-range with strong data, a learner-friendly interface, and now an optional ROFFS integration for captains who want to step up without switching platforms. SatFish delivers reliable structure and temperature mapping at the most accessible price point in the comparison. RipCharts gives tournament anglers the highest update frequency in the value tier.
Login
to leave a review.
User Reviews
There are no reviews yet.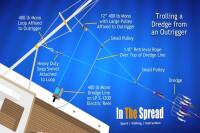
Complete Dredge Pulley Setup Guide
Saltwater
12.28.2020
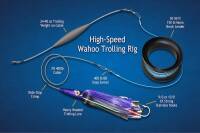
High Speed Wahoo Trolling Rig
Saltwater
09.08.2018
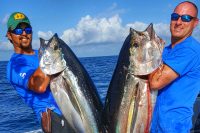

Fishing Light Tackle for Yellowfin Tuna
Saltwater
09.08.2018


Fishing Gulf of Mexico Inshore Waters
Saltwater
11.28.2023

0