Sea surface height tells you more about where fish will be than most anglers realize. When you know how to read altimetry data alongside temperature and chlorophyll charts, you stop guessing and start targeting the specific oceanographic features that concentrate baitfish and gamefish offshore.

Altimetry Data: Read the Ocean, Find More Fish
How Altimetry Data Puts You on More Fish Offshore
If you fish offshore seriously, you already know that finding fish is mostly about finding the right water. Temperature breaks, color changes, current edges — these are the things that separate a productive trip from a long, expensive boat ride. Altimetry data gives you another layer of intelligence that most anglers ignore, and the ones who use it well are consistently putting themselves in better position to find fish.
What Is Altimetry and How Does Satellite Altimetry Work?
Altimetry is the measurement of sea surface height relative to a fixed reference level. In oceanography, that reference is the Earth's geoid, essentially a model of mean sea level. When scientists say "sea surface height anomaly," they mean the deviation from that baseline, and those deviations tell a story about what is happening beneath the surface.
Satellite altimeters, including those aboard the Jason series, the European Space Agency's Sentinel-6, and NASA's newer SWOT (Surface Water and Ocean Topography) mission, which delivers significantly higher spatial resolution than earlier systems, do this by emitting radar pulses toward the ocean. The pulses reflect off the surface and return to the satellite, and the travel time is measured precisely. Combined with exact satellite positioning data, that measurement gives researchers and fishermen a detailed picture of sea surface height across entire ocean basins, updated frequently.
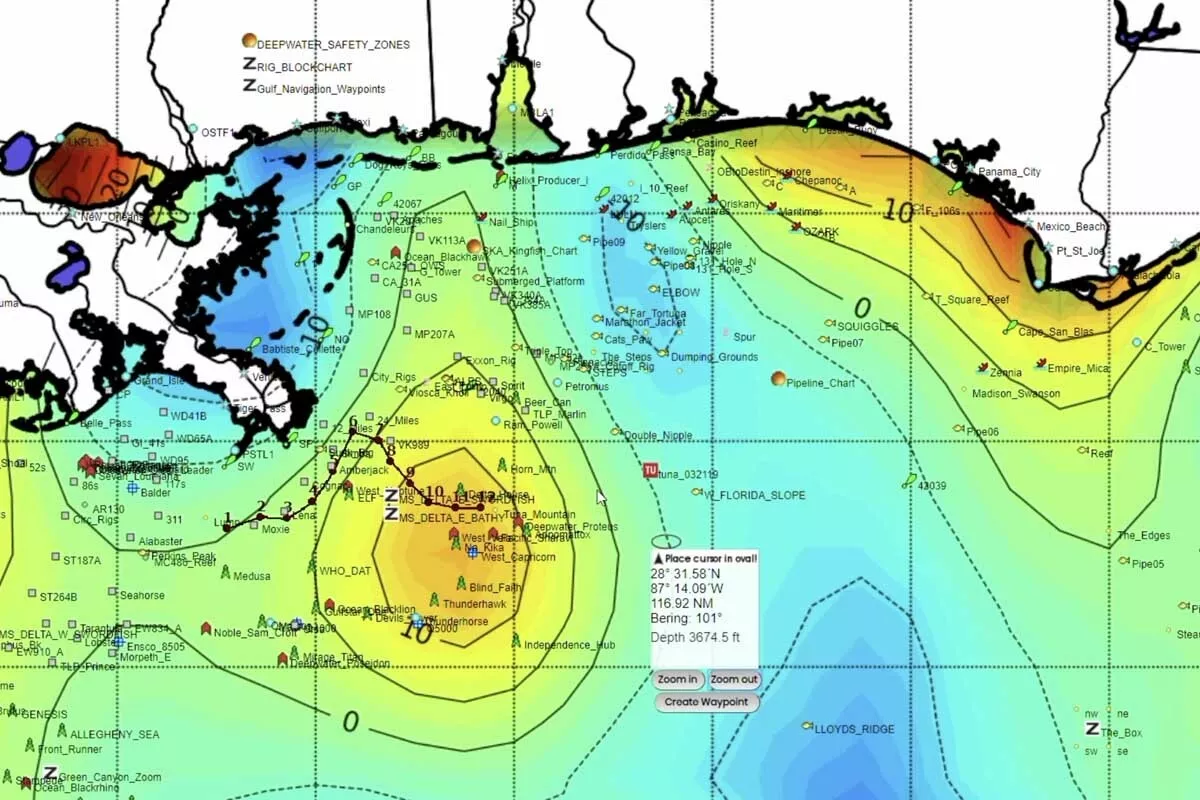
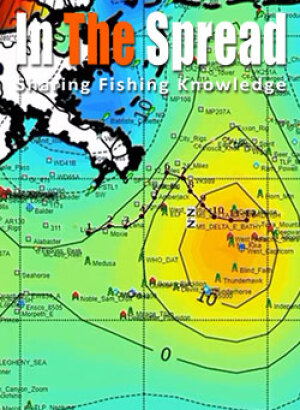
What makes this useful for fishing is simple: sea surface height variations reveal where ocean energy is concentrated. Elevated areas often mark warm-core eddies spinning offshore. Depressed areas can signal upwelling or cold-core circulation. One important caveat worth knowing: chart conventions vary across services, and some tools actually display high SSHA as a downwelling signal where nutrient-poor water dominates. Always overlay SST and chlorophyll data to confirm whether productivity is actually elevated in a given area before committing to it. The contrast between these features is where fish stack up.
Learn to Read Satellite Data for Fishing
How Does Sea Surface Height Reveal Productive Fishing Areas?
The relationship between sea surface height and fish location is not a coincidence. Ocean water responds to the same physical forces that drive weather systems, and those forces create features that concentrate the food chain.
A positive sea level anomaly, meaning water that is elevated above the baseline, typically indicates a warm-core eddy. These spinning bodies of water rotate clockwise in the Northern Hemisphere, trap warmer surface water, and push nutrient-rich deep water toward their edges. That edge zone is where bait aggregates and where predators come to feed.
A negative anomaly, water sitting below the mean, often points to cold-core circulation or active upwelling. This is where deep, nutrient-dense water is being pulled to the surface, feeding phytoplankton blooms that launch the entire food chain.
The boundary between a positive and negative anomaly is an ocean front. These fronts are among the most productive fishing areas in any offshore environment. Altimetry gives you a way to locate them before you leave the dock.
- Ocean eddies, both warm-core and cold-core, which trap nutrients and concentrate bait species along their edges
- Current boundaries and fronts where different water masses meet and bait stacks up
- Upwelling zones where deep, nutrient-rich water rises and fuels the food chain
- Sea level anomalies that reveal mesoscale circulation patterns otherwise invisible at the surface
Why Do Upwelling Zones Produce Better Offshore Fishing?
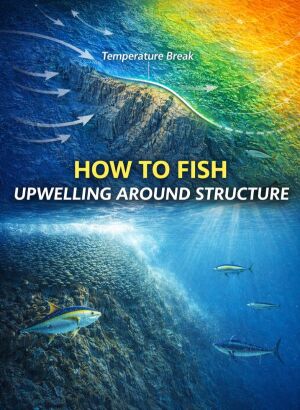
Ask any experienced offshore captain where they want to fish and they will tell you they want to be on structure or on a temperature break with clean water. What they may not say explicitly is that those temperature breaks are often the surface signature of upwelling, and upwelling is one of the most reliable fish-concentrating mechanisms in the ocean.
Upwelling happens when deep, cold water rises to replace warmer surface water that has been pushed away by wind-driven circulation or the interaction of currents with the sea floor. That cold, deep water is loaded with nutrients, specifically nitrates, phosphates, and silicates, that have accumulated far below the sunlit zone. When those nutrients hit sunlit surface water, phytoplankton blooms. Zooplankton follow. Baitfish follow the zooplankton, and gamefish follow the bait.
That is the entire food chain compressed into a predictable geographic feature, and altimetry helps you find it.
Upwelling zones are also relatively predictable. Many are tied to specific coastal geography, submarine canyons, shelf breaks, or headlands that deflect currents in consistent ways. Altimetry data, especially when combined with sea surface temperature charts, lets you confirm that an upwelling event is actually occurring and identify the best edges to target.
Learn more about reading these dynamics in Upwelling and Altimetry Maps for Sport Fishing.
Why Should Offshore Fishermen Avoid Downwelling Areas?
If upwelling creates the conditions that concentrate fish, downwelling does the opposite. Understanding why is just as valuable as knowing where upwelling occurs, because it tells you where not to waste your time and fuel.
Downwelling happens when surface water is pushed downward by converging currents or wind circulation. That sinking water is typically warm and nutrient-depleted. When it sinks, it takes whatever nutrients remain in the surface layer down with it, leaving behind water that is relatively sterile and unproductive for the food chain.
Less phytoplankton means less zooplankton. Less zooplankton means fewer baitfish. Fewer baitfish means the larger predators that you are targeting have less reason to be there. You can catch the occasional fish anywhere offshore, but if you are consistently targeting downwelling areas, you are working against the biology.
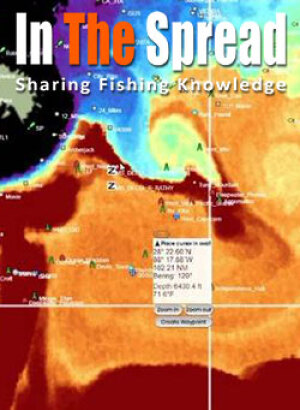
Altimetry helps you identify these zones and steer clear of them. When you see a positive sea level anomaly that is isolated and surrounded by relatively flat water, with no frontal boundary nearby, that can be a signal of a downwelling-dominated environment. Cross-reference with chlorophyll data and you will see low productivity confirming the picture.
How Do You Combine Altimetry with Sea Surface Temperature and Chlorophyll Data?
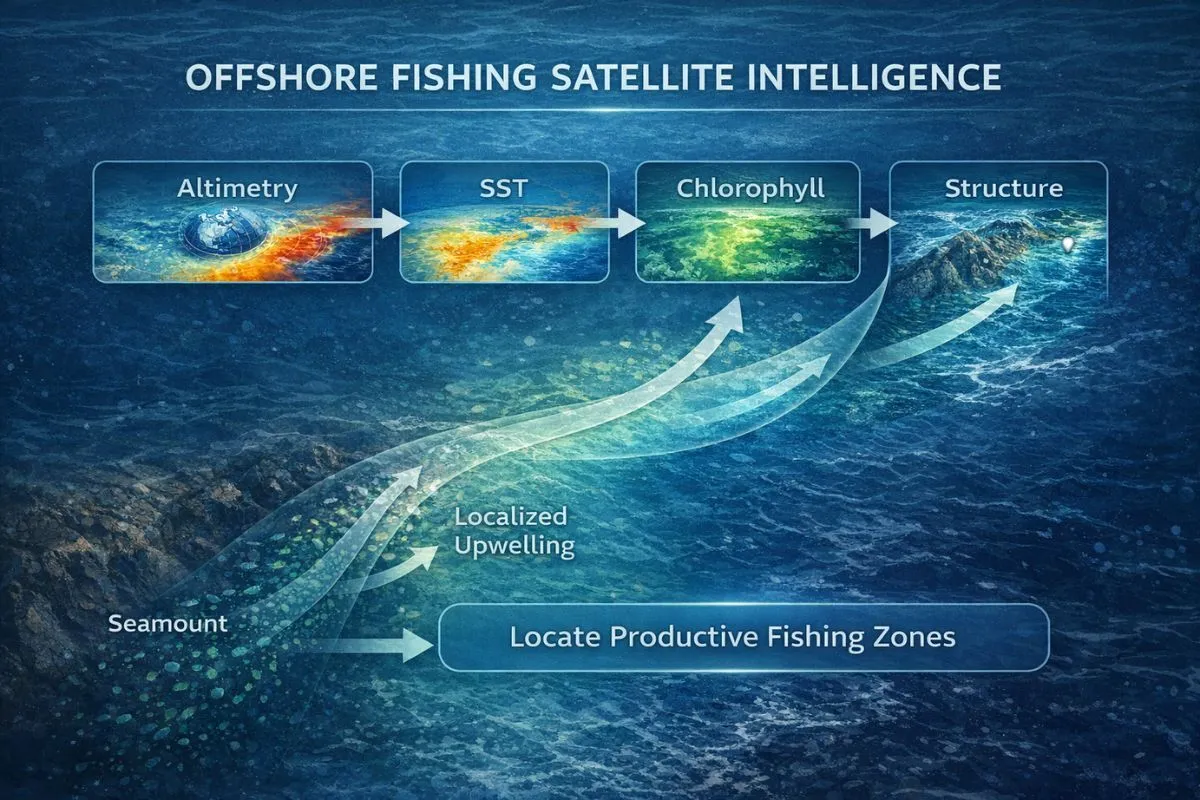
Using altimetry by itself gives you a useful but incomplete picture. The real power comes from correlating altimetry, sea surface temperature (SST), and chlorophyll concentration together. Each data layer tells you something different, and the overlap between favorable readings across all three is where you want to focus your efforts.
Think of it as triangulation. Altimetry shows you the physical structure of the water column. SST shows you the thermal landscape. Chlorophyll shows you where primary productivity is actually happening. When all three point at the same location, you have a high-confidence target.
- Altimetry data reveals sea level anomalies that indicate eddies, fronts, and upwelling or downwelling activity
- SST data identifies thermal gradients and temperature breaks where different water masses converge
- Chlorophyll concentration locates areas of high phytoplankton growth, signaling active nutrient upwelling and a productive food chain
- Salinity charts add another layer of confirmation, especially in areas where freshwater discharge or current mixing affects fish distribution
When a positive altimetry anomaly (eddy edge) lines up with a strong SST break and elevated chlorophyll, you have a convergence of conditions that creates exceptional fishing potential. This is the framework the best offshore anglers use when they are pre-planning trips.
How Does Underwater Structure Relate to Altimetry and Satellite Data?
One thing that separates consistently productive offshore anglers from everyone else is an understanding of how the physical ocean floor shapes the water above it. Underwater structure, including seamounts, submarine canyons, shelf breaks, and artificial reefs, interacts directly with the oceanographic conditions that altimetry reveals.
When a strong current hits a seamount or canyon edge, it deflects and creates upwelling on one side and a lee zone on the other. Bait concentrates in these transition areas. The altimetry signature over these features often shows elevated sea surface height anomalies as currents pile against them or eddies pin against the structure.
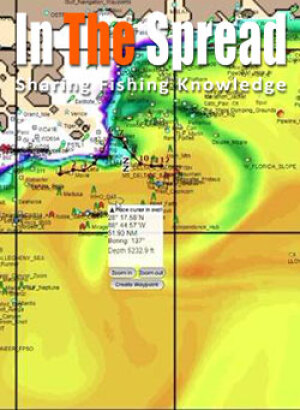
By overlaying your altimetry charts with bathymetric data, you can identify when favorable current conditions are aligning with the bottom topography you already know holds fish. A seamount that sits at the edge of a cold-core eddy, where upwelling is active and chlorophyll is elevated, is an entirely different fishing proposition than that same seamount sitting in flat, warm, unproductive water.
This approach also reduces the randomness of fishing. Instead of covering water and hoping, you are targeting the intersection of physical structure, oceanographic energy, and biological productivity. That is how professional captains make decisions, and it is information that satellite data puts within reach of any serious offshore angler.
Learn More About Altimetry and Satellite Maps for Fishing
What Are the Best Free Satellite Data Sources for Offshore Fishermen?
Not every offshore angler needs a paid subscription service to access useful satellite oceanographic data. Several government and institutional sources provide free, high-quality data that you can learn to read and apply to your fishing.
NOAA CoastWatch offers sea surface temperature, ocean color (chlorophyll), altimetry, and wind data through their OceanWatch portal. It is updated regularly and is one of the most used free resources among serious anglers.
NASA OceanColor Web focuses on chlorophyll concentration and ocean color products derived from satellite imagery rather than direct altimetry. It does not provide SSHA data, but it is an excellent complementary tool for confirming biological productivity in the areas your altimetry charts highlight. The resolution is strong and it is particularly useful for identifying active productivity zones well offshore.
Copernicus Marine Service, operated by the European Union's Earth Observation Program, offers a comprehensive suite including sea level anomaly, SST, chlorophyll, and current data. The interface is more technical but the data quality is exceptional. Access it at marine.copernicus.eu.
What Subscription Services Do Offshore Fishermen Use for Satellite Data?
For anglers who want expert interpretation, cleaner presentation, and real-time updates without building their own data workflow, several subscription services have built strong reputations in the offshore fishing community.
Hilton's Realtime Navigator is one of the most trusted names in offshore satellite data for fishermen. Tom Hilton and his team provide real-time maps integrating SST, altimetry, chlorophyll, and ocean currents, along with expert analysis that translates raw data into actionable fishing intelligence. If you are serious about satellite-informed offshore fishing, this service is worth exploring at realtime-navigator.com.
ROFFS (Roffer's Ocean Fishing Forecasting Service) has been serving offshore anglers for decades with customized fishing forecasts built from satellite data and deep fisheries science expertise. Their reports are tailored to specific areas and target species, which makes the information highly actionable. Find them at roffs.com.
SatFish packages SST, chlorophyll, bathymetry, currents, and weather into a single high-definition mapping interface designed specifically for offshore anglers. It is a strong option for those who want everything in one place. Access it at app.satfish.com.
What separates these services from the free options is not primarily the underlying data, it is the expert analysis, the user-friendly presentation, and the real-time updates that make the information immediately usable on a fishing trip. For many anglers, that value more than justifies the cost.
Frequently Asked Questions About Altimetry and Offshore Fishing
What is altimetry in the context of offshore fishing?
Altimetry is the measurement of sea surface height using satellite radar pulses. For offshore fishermen, it reveals ocean eddies, upwelling zones, fronts, and current boundaries that concentrate bait and gamefish. A sea surface height anomaly, meaning water that sits higher or lower than the average, signals the oceanographic features that matter most for finding fish.
How does sea surface height affect where fish are located?
Fish follow food, and food follows oceanographic energy. Elevated sea surface height often marks a warm-core eddy whose edges concentrate nutrients, bait, and predators. Depressed sea surface height can indicate upwelling or cold-core circulation, which draws deep, nutrient-rich water to the surface and fuels the food chain from the bottom up.
What is the difference between upwelling and downwelling for offshore fishing?
Upwelling brings cold, nutrient-rich deep water to the surface, fueling phytoplankton growth and concentrating the entire food chain. It creates some of the most productive fishing conditions in the ocean. Downwelling pushes nutrient-poor surface water downward, reducing productivity and making an area less attractive for fish. Altimetry data helps you identify both.
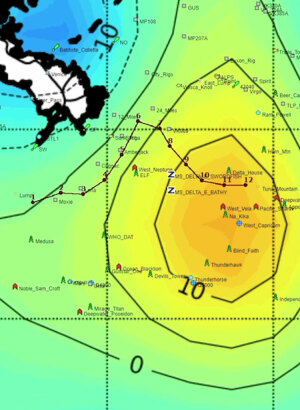
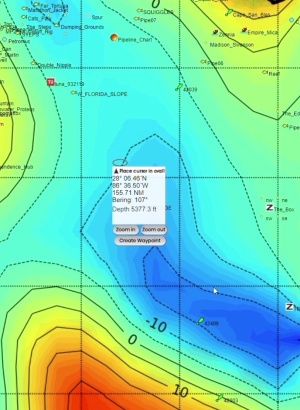
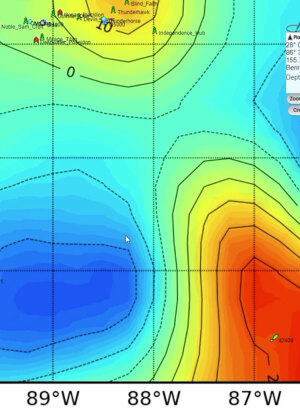
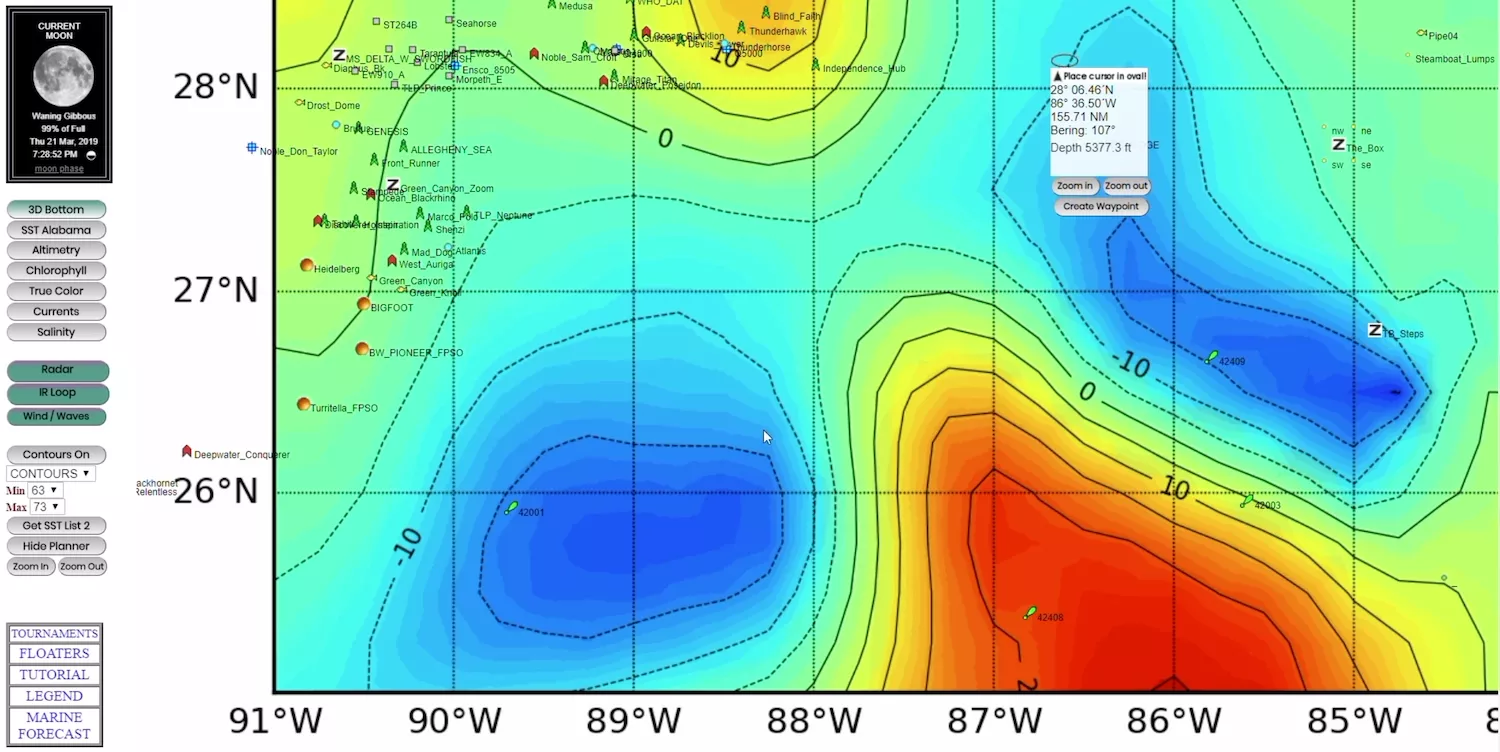
How do I read an altimetry chart for offshore fishing?
Altimetry charts typically use a color gradient to represent sea surface height anomalies (SSHA). Warm colors like red and orange indicate elevated water, often marking warm-core eddies. Cool colors like blue and purple indicate depressed water, often associated with upwelling or cold-core features. However, chart display conventions vary across services. Some tools invert the relationship for fishing-specific visuals, so always cross-reference with SST and chlorophyll data to confirm what the SSHA pattern is actually telling you about productivity. The edges and boundaries between these zones remain the most productive areas to target regardless of which convention your service uses.
What other satellite data should I use alongside altimetry?
Sea surface temperature (SST) and chlorophyll concentration are the two most important layers to combine with altimetry. SST identifies thermal breaks and temperature gradients. Chlorophyll shows where primary productivity is highest. When altimetry anomalies, SST breaks, and elevated chlorophyll all converge in the same area, you have a high-confidence fishing target.
Are there free satellite data tools offshore fishermen can use?
Yes. NOAA CoastWatch and Copernicus Marine Service both provide free access to SSHA, SST, and current data. NASA OceanColor Web is a strong complementary tool for chlorophyll and ocean color but does not provide direct altimetry data. Used together, these free resources give you a solid multi-layer picture of offshore oceanographic conditions.
What subscription fishing satellite services do professional captains use?
Hilton's Realtime Navigator, ROFFS, and SatFish are among the most widely used subscription services. Each packages satellite data with expert analysis and user-friendly interfaces, making complex oceanographic information immediately usable for fishing trip planning.
Putting Altimetry to Work on Your Next Offshore Trip
The offshore fishermen who consistently find fish are the ones who spend as much time planning before the trip as they do fishing during it. Altimetry is one of the most powerful planning tools available, and for most anglers, it remains underused.
Start by pulling your altimetry chart alongside your SST and chlorophyll data before every offshore trip. Identify the positive anomalies, locate the eddy edges, note where upwelling signatures appear, and cross-reference all of it with the bottom structure you already know. When those elements stack up in the same location, you are not guessing anymore.
Login
to leave a review.
User Reviews
There are no reviews yet.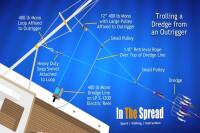
Complete Dredge Pulley Setup Guide
Saltwater
12.28.2020
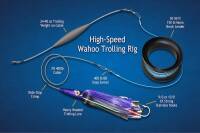
High Speed Wahoo Trolling Rig
Saltwater
09.08.2018
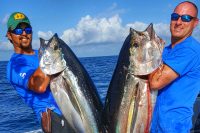
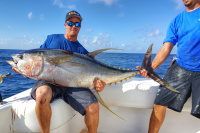
Fishing Light Tackle for Yellowfin Tuna
Saltwater
09.08.2018

Fishing Gulf of Mexico Inshore Waters
Saltwater
11.28.2023

0