Altimetry maps and ocean upwelling data cut through the guesswork of offshore fishing. Understanding sea surface height anomalies, current fronts, and upwelling zones puts you on tuna, marlin, and other pelagic fish faster and more consistently. This is the science behind where the fish are, and how the best offshore captains locate them before they ever leave the dock.
Ocean Upwelling and Altimetry Maps for Offshore Fishing
Spend enough time offshore and you realize the ocean is not random. Fish are not scattered across millions of square miles of blue water. They stack in specific places for specific reasons, shaped by forces you cannot see from the cockpit: wind, current, depth, temperature, nutrient density. All of it is connected, all of it is moving, and all of it matters if you want to find fish consistently instead of by luck.
Reading the surface only tells part of the story. The deeper story, the one that explains why fish are stacking in one patch of ocean and ignoring another, plays out below the surface, driven by dynamics you need technology to see.
What Is Ocean Upwelling and Why Does It Matter for Fishing?
Ocean upwelling is the process by which deeper, colder, nutrient-rich water rises toward the surface. When winds push surface water away from a coastline or current boundary, deeper water moves in to fill that space, carrying nutrients that have accumulated far below the light zone. Once those nutrients reach the sunlit surface layer, phytoplankton populations explode. Zooplankton follow. Baitfish like sardines, anchovies, and squid pile in after them. Then the predators arrive: yellowfin tuna, bluefin tuna, marlin, sailfish, mahi-mahi. The full pyramid builds fast.
What Exactly Is an Altimetry Map?
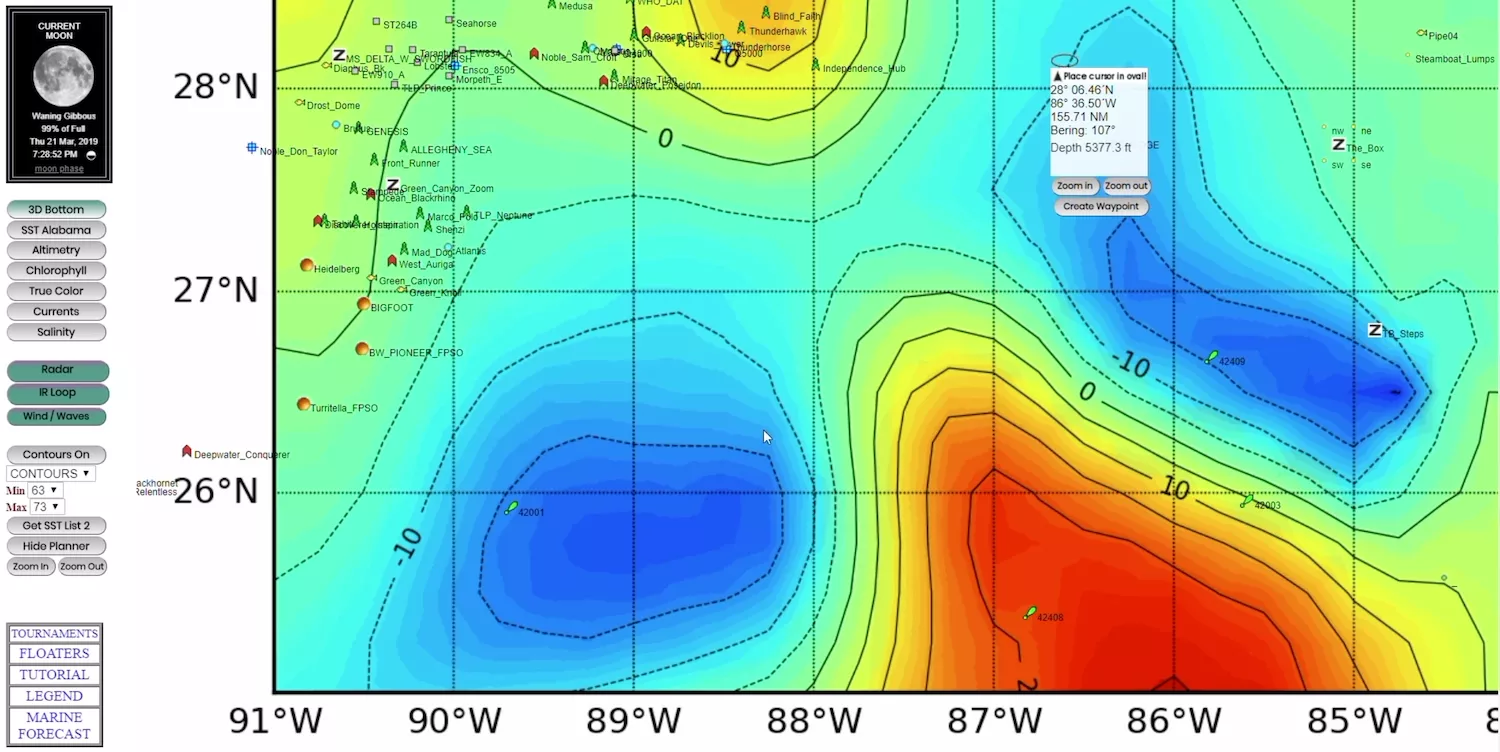
An altimetry map is a satellite-derived chart that measures the physical height of the ocean surface. Because water is denser and warmer in some areas than others, the sea surface is not flat. It rises and falls in ways that reflect what is happening beneath it.
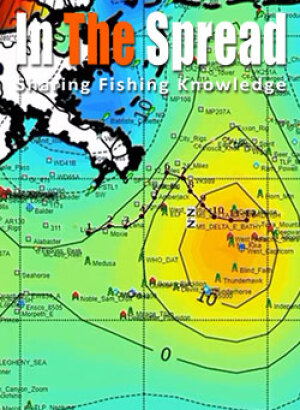
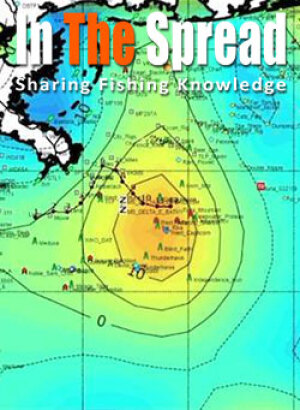
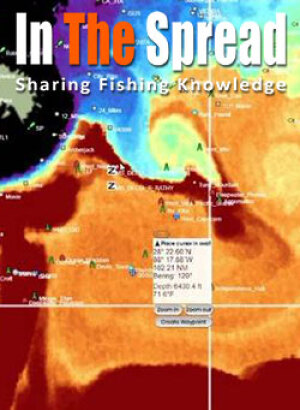
The core principle: where water is warm and less dense, the ocean surface tends to rise. Where cold, dense water pushes toward the surface, the ocean often dips. Those depressions, shown in cool blues and purples on altimetry charts, are frequently associated with elevated nutrient loading and biological productivity.
The measurement used is sea surface height (SSH) anomaly, which is actual ocean height compared to a long-term average. A negative SSH anomaly often indicates cold, dense water rising from depth and is frequently associated with productive upwelling conditions. A positive anomaly typically means elevated, warmer water associated with warm-core eddies. Not every negative SSH signal is a clean, surface-expressed upwelling plume, since broader oceanographic dynamics can influence the reading, so always confirm with SST and chlorophyll before making decisions.
An SSH gradient is simply the transition zone between lower and higher sea surface heights. On the map, it is where contours are packed tightly together: a sharp boundary between water masses. That boundary is where the fishing action is.
What Is Downwelling and Why Should You Avoid It?
Before going further on what to target, it is worth understanding the opposite condition: downwelling. Where upwelling pulls productive water toward the surface, downwelling pushes surface water downward. Nutrients and plankton are driven below the light zone. Primary productivity drops. Bait thins out. Pelagic predators move on. On an altimetry chart, strongly positive SSH anomalies often represent the least productive surface water you can fish.
Learn to Read Satellite Maps for Fishing
How Do You Read an Altimetry Map to Find Fish?
Reading altimetry for fishing comes down to one principle: for open-water pelagic species, the fish are rarely in the center of an upwelling-linked feature. They are at the edges, where cold nutrient-rich water from below meets warmer offshore water. Those convergent boundaries, called fronts, are where bait schools up and predators come to feed.
When you pull up an altimetry chart, the workflow looks like this:
- Identify SSH anomaly gradients, the transition zone between negative and positive anomalies. Tight gradients indicate sharp fronts, which concentrate bait and trigger feeding.
- Locate cold-core eddies (negative anomalies, often spinning cyclonically). Their outer edges are some of the most consistently productive offshore fishing terrain in any ocean.
- Note warm-core eddies (positive anomalies). Fish the convergence zone where a warm eddy boundary meets a cold-side feature, not the warm interior.
- Layer in sea surface temperature (SST) charts to cross-reference what the SSH data is suggesting with actual surface temperatures. When a tight SSH gradient and a sharp temperature break line up in the same location, you have a high-confidence front.
- Add chlorophyll data if your platform supports it. Green water pushed against blue means active phytoplankton and a working food chain.
What Are the Limitations of Altimetry Data Offshore?
Altimetry is a powerful tool, but it is not a real-time feed. Most satellite altimetry used in sport fishing applications is processed with a lag of roughly 24 to 72 hours and is spatially smoothed. You are looking at a recent snapshot of persistent oceanographic features, not a live view of exactly where a temperature break sits right now.
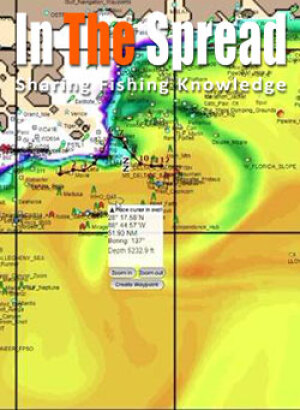
How Do You Combine Altimetry with SST Charts and Bathymetry?
The full picture comes from layering three data types: altimetry, SST, and bathymetry. Start with altimetry to identify large-scale features: where eddies are positioned, where frontal boundaries fall, which areas are likely productive versus dead. Overlay SST to confirm what the surface is actually doing at those boundaries. Then bring in your bottom contour charts.
Canyons, seamounts, and shelf breaks interact with current-driven features in ways that further concentrate fish. An altimetry-defined frontal edge running across a submarine canyon or along a shelf break is fundamentally different from the same front over featureless deep water. The physical structure gives fish a reason to hold rather than pass through. That convergence of oceanographic conditions and bottom structure is where the most experienced offshore captains focus first.
How to Use Altimetry for Specific Species: Yellowfin Tuna and Swordfish
Understanding the framework is one thing. Knowing how to apply it when you are staring at a map the night before a trip is another. Here is how that logic translates for two of the most targeted offshore species.
Yellowfin tuna. Look for a negative SSH anomaly with a well-defined edge transitioning toward neutral or positive values. Confirm with a one- to three-degree SST break on your temperature chart. That edge is your trolling corridor. Run parallel to the boundary, keeping your spread in the transition zone between cool productive water and warmer adjacent current. If a canyon head or shelf break falls along that same line, weight your effort there heavily. Yellowfin tend to stack at the intersection of frontal and structural features.
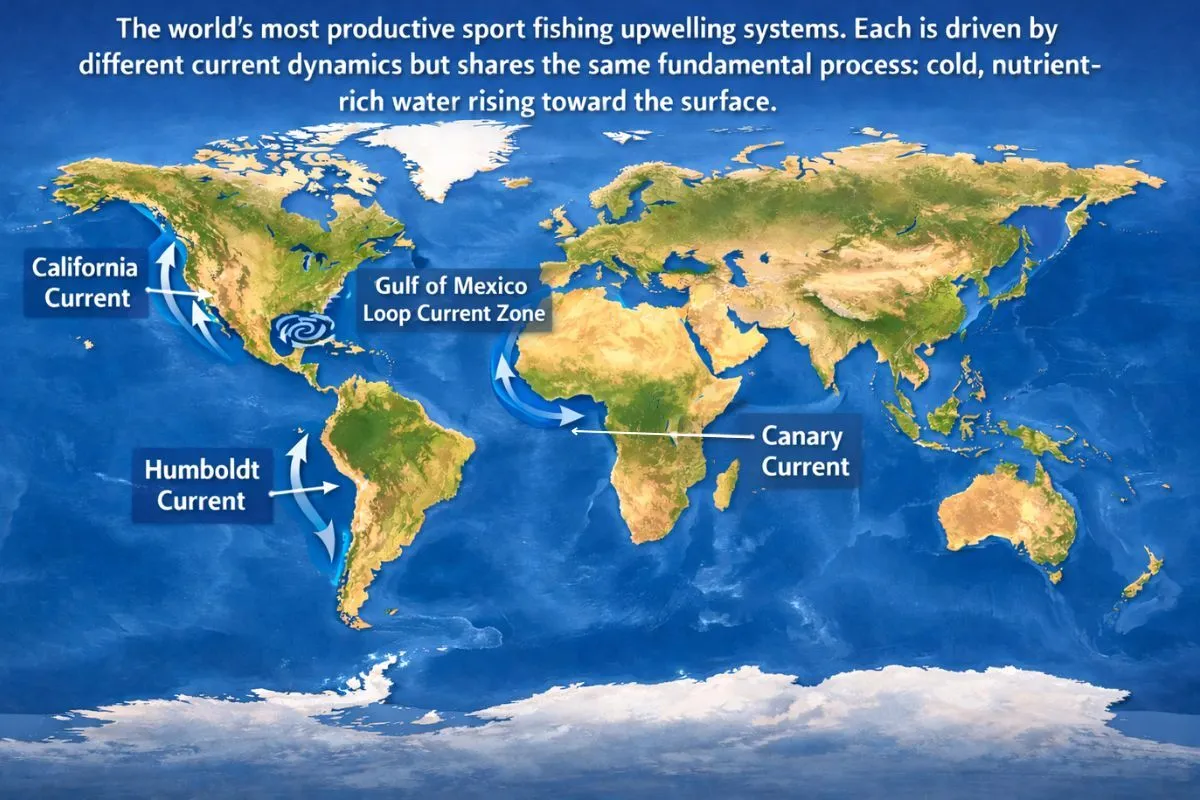
Where Are the Best Upwelling Fishing Regions in the World?
Upwelling occurs in every ocean on earth, but certain systems produce it with a regularity and intensity that drives world-class sport fishing. Understanding the dynamics of each one helps you apply the right tactics in the right location.
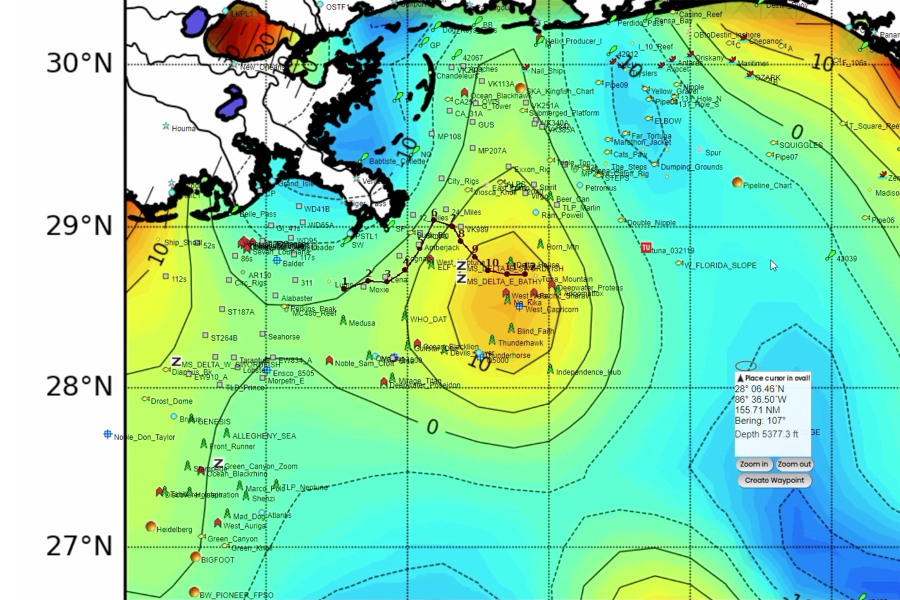
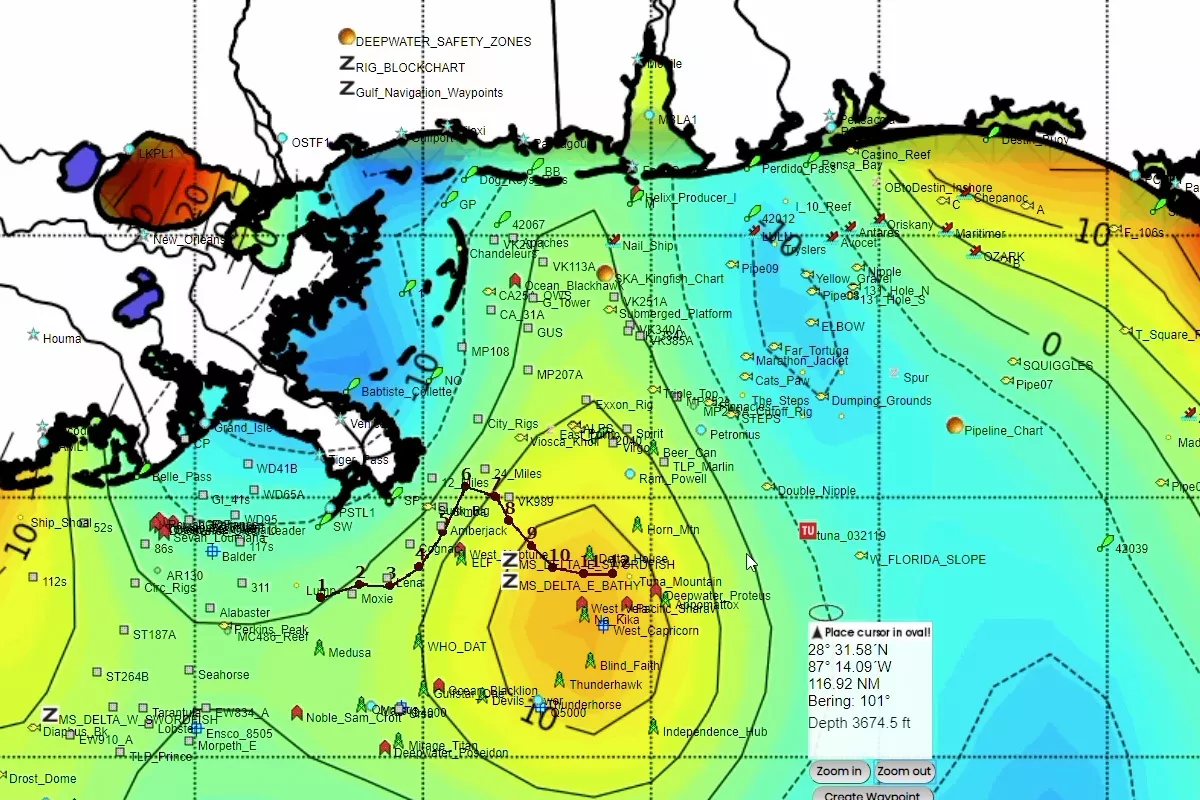
Does the Gulf of Mexico Have Productive Upwelling for Sport Fishing?
Yes, and the primary driver is the Loop Current. The Loop Current is a warm ocean current that flows northward into the Gulf from the Caribbean, loops southeastward, and exits through the Florida Straits to join the Gulf Stream. As it moves through the Gulf, it spins off large rotating eddies, and those eddies are the key to offshore fishing productivity in the region.
As Loop Current eddies push against the continental shelf, they drive upwelling events along their outer edges, pulling deep, nutrient-rich water toward the surface. These interactions tend to be most pronounced during summer months, when the current's northern extension increases contact with shelf-edge regions. That timing overlaps with critical spawning and growth periods for many grouper, snapper, and mackerel species in the Gulf, and the resulting nutrient influx boosts baitfish populations, drawing pelagic predators into fishable concentrations.
How Does the California Current Drive Tuna Fishing on the West Coast?
The California Current is one of the most powerful eastern boundary upwelling systems in the world, stretching from British Columbia down through Baja California. As northwest winds push surface water offshore during summer months, cold, nutrient-dense water wells up along the coast with remarkable consistency, supporting dense populations of krill, anchovies, and sardines that draw:
- Albacore tuna following cool water temperature breaks offshore from late summer into fall
- Yellowfin tuna aggregating along warm-cool fronts near the Channel Islands and Point Conception
- Pacific bluefin tuna staging along current edges from Southern California northward
What Makes the Canary Current a World-Class Fishing Destination?
The Canary Current runs southward along the northwest coast of Africa, carrying cold North Atlantic water into the tropical eastern Atlantic. When it meets trade winds blowing across the African coast, intense upwelling events produce an explosion of marine life. Enormous sardine schools congregate in the productive water, drawing yellowfin tuna, blue marlin, and sailfish in substantial numbers. Destinations including Morocco, Western Sahara, and Mauritania draw serious pelagic anglers specifically because of the seasonal predictability this system produces.
Why Is the Humboldt Current One of the World's Most Productive Fishing Systems?
The Humboldt Current flows northward along the coasts of Chile and Peru, supporting one of the most biologically productive marine ecosystems on the planet. Persistent trade winds drive major upwelling events that generate staggering concentrations of anchovies and sardines. Mahi-mahi, yellowfin tuna, striped marlin, and black marlin all range through the region in numbers that rival the best destinations globally. El Niño events suppress upwelling significantly, which is why pre-trip altimetry analysis is particularly valuable here. It tells you whether the system is actively producing before you commit to the travel.
What Does the Future of Upwelling Forecasting Mean for Sport Fishing?
Next-generation altimetry sensors are delivering finer spatial resolution, making it possible to identify smaller-scale current boundaries and eddies that earlier satellites missed. Forecasting models integrating SSH, SST, chlorophyll, and current data are moving toward systems that project where productive fronts will form days in advance. In some regions these products are commercially available; in others they remain research-grade. Worth understanding what your specific platform is actually delivering before treating a forecast as certainty.
Frequently Asked Questions About Altimetry Maps and Upwelling for Fishing
What is an altimetry map used for in fishing?
An altimetry map shows the physical height of the ocean surface as measured by satellite. Fishermen use it to identify areas often associated with upwelling, locate warm and cold-core eddies, and find the current boundaries and fronts where bait and pelagic fish concentrate. Always confirm SSH signals with SST and chlorophyll before committing to a location.
What does a negative SSH anomaly mean on an altimetry chart?
A negative sea surface height anomaly means the ocean surface is lower than the historical average. This is frequently associated with cold, dense water rising from depth and elevated nutrient conditions. It is not always a clean indicator of active upwelling on its own, so cross-reference with SST and chlorophyll to confirm productivity.
What is the difference between upwelling and downwelling for fishing?
Upwelling brings cold, nutrient-rich water toward the surface, fueling the food chain from phytoplankton through pelagic predators. Downwelling pushes surface water downward, reducing productivity and driving fish away. Strongly positive SSH anomalies are often associated with downwelling conditions. Fish the edges of warm-core eddies, not their interiors.
Why are upwelling edges better fishing than the upwelling center?
For open-water pelagic species, the convergent boundary where cold upwelled water meets warmer offshore water is where bait schools concentrate. That compression triggers feeding. The largest concentrations of tuna, marlin, and billfish are typically found working those edges rather than holding in the cold interior.
What is the Loop Current and why does it matter for Gulf of Mexico fishing?
The Loop Current flows into the Gulf of Mexico from the Caribbean, extends northward, and exits through the Florida Straits to become the Gulf Stream. As it moves through the Gulf, it spins off large eddies that drive upwelling events along the continental shelf edges, creating productive zones for yellowfin tuna, blue marlin, wahoo, and swordfish.
How current is altimetry data and what are its limitations?
Most altimetry data in sport fishing applications carries a lag of 24 to 72 hours and is spatially smoothed. Hunt large, stable features that persist over days, not small pixel-level variations. Close to shore, altimetry signal quality degrades. Rely more on SST and chlorophyll in nearshore situations.
The Bottom Line on Reading the Ocean Below the Surface
The ocean is not a mystery. It is a system. Upwelling, current dynamics, eddy formation, thermal fronts: these forces are predictable, mappable, and directly connected to where the fish are. Anglers who learn to read satellite altimetry alongside SST and chlorophyll data are not getting lucky. They are making informed decisions based on real ocean intelligence.
Learn the framework, understand the limitations, and apply it against your knowledge of local bathymetry and species behavior. That combination closes the gap between where you are fishing and where you should be.
Login
to leave a review.
User Reviews
There are no reviews yet.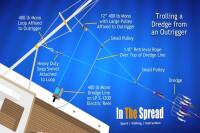
Complete Dredge Pulley Setup Guide
Saltwater
12.28.2020
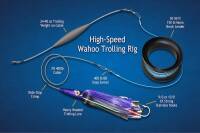
High Speed Wahoo Trolling Rig
Saltwater
09.08.2018

Fishing Gulf of Mexico Inshore Waters
Saltwater
11.28.2023
0