Start fishing better with FREE Weekly Video Tips delivered straight to your email.
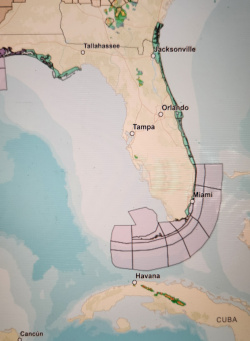
satellite fishing
-
2024, How to Read Satellite Images of Ocean Surface Currents
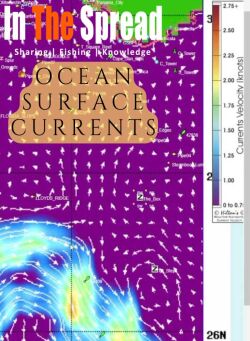
Ocean surface currents concentrate baitfish and gamefish in predictable zones revealed through satellite image analysis. Understanding arrow patterns for current direction and speed, identifying upwelling and downwelling zones where vertical movement affects prey, and recognizing warm core eddies that trap bait transforms random offshore searching into informed decisions about where conditions align to create prime fishing locations.
WATCH NOW -
2019, How Altimetry Charts Improve Fishing Forecast
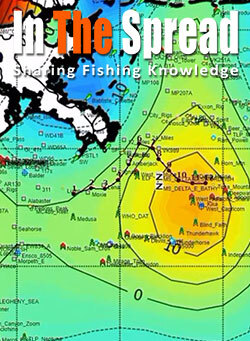
Temperature and chlorophyll satellites show surface conditions but miss the vertical water movements driving productivity. Tom Hilton explains how altimetry reveals upwelling bringing nutrients from depth versus downwelling pulling them away, why upwelling edges outperform centers for predator positioning, and what sea surface height variations indicate about food chain sustainability.
WATCH NOW -
2019, Hiltons Offshore Satellite Fishing Maps
Running offshore without calculating fuel burn to satellite-identified features versus closer alternatives wastes money on marginal trips. Thomas Hilton's integrated trip planner combines oceanographic data with weather forecasting and fuel consumption calculations, helping captains decide whether distant temperature breaks justify runs or intermediate zones provide better fishing per dollar spent.
WATCH NOW -
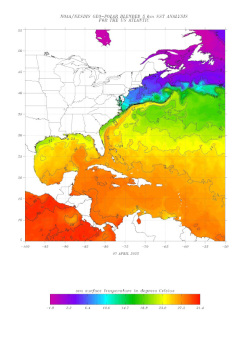
2025, Reading SST Charts to Find Offshore Gamefish
Sea surface temperature charts show you the ocean's thermal structure before you run a mile. Learn to identify the breaks, eddies, and upwellings that concentrate baitfish and pelagic predators, match those features to species-specific temperature ranges, and layer in chlorophyll and altimetry data to build a high-confidence plan the night before your trip.
READ MORE -
2025, Reading a Fishing Forecast: Data, Tools, and Decisions
A productive fishing forecast pulls from satellite oceanography, tidal data, barometric pressure, and celestial timing. Each data layer narrows the probability of where fish will be and when they will feed. This article breaks down what each variable tells you, how the layers work together, and how experienced anglers translate data into decisions before they leave the dock.
READ MORE -
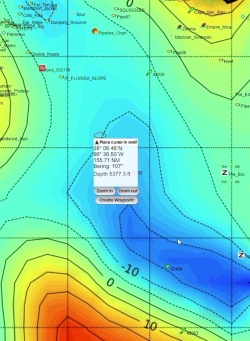
2023, Ocean Upwelling and Altimetry Maps for Offshore Fishing
Altimetry maps and ocean upwelling data cut through the guesswork of offshore fishing. Understanding sea surface height anomalies, current fronts, and upwelling zones puts you on tuna, marlin, and other pelagic fish faster and more consistently. This is the science behind where the fish are, and how the best offshore captains locate them before they ever leave the dock.
READ MORE