Sea surface temperature analysis eliminates guesswork in offshore fishing by revealing where target species concentrate along thermal boundaries. Learn to interpret SST charts, identify productive temperature breaks, and position yourself where fish aggregate before competitors arrive.
Fishing Temperature Charts: Complete Guide to SST Data for Offshore Success
SST or Fishing Temperature Charts for Offshore Fishing Success
Modern sst or fishing temperature charts have revolutionized how serious anglers approach offshore fishing, turning what was once guesswork into precision targeting. Today's satellite technology allows you to pinpoint productive fishing grounds with remarkable accuracy, saving precious fuel and dramatically increasing your success rates on the water.
Understanding Sea Surface Temperature Fundamentals
Sea surface temperature fishing relies on sophisticated satellite technology that captures precise water temperature data from space. These advanced systems utilize both infrared sensors with high spatial resolution and microwave sensors capable of penetrating cloud cover, ensuring comprehensive data coverage even during challenging weather conditions.
The science behind temperature-based fishing centers on a fundamental biological principle: fish are cold-blooded creatures whose activity levels and feeding behaviors directly correlate with water temperature. When water temperatures align with a species' preferred range, their metabolism increases, triggering more aggressive feeding patterns and making them significantly easier to catch.
How Temperature Affects Fish Behavior
Understanding the relationship between water temperature and fish behavior forms the foundation of successful temperature-based fishing strategies. Each species has evolved to thrive within specific temperature ranges where their physiological processes operate most efficiently.
Baitfish species concentrate along temperature boundaries because these areas often contain optimal conditions for feeding and reproduction. Small baitfish like sardines, anchovies, and flying fish gather in massive schools along these thermal boundaries, creating irresistible feeding opportunities for larger predator species.
How to Use Satellite Maps for Fishing
Target Species Temperature Ranges
Successfully targeting specific species requires understanding their preferred temperature ranges and how these preferences change throughout the year. Offshore fishing temperature data becomes most valuable when you can match current water conditions to your target species' comfort zones.
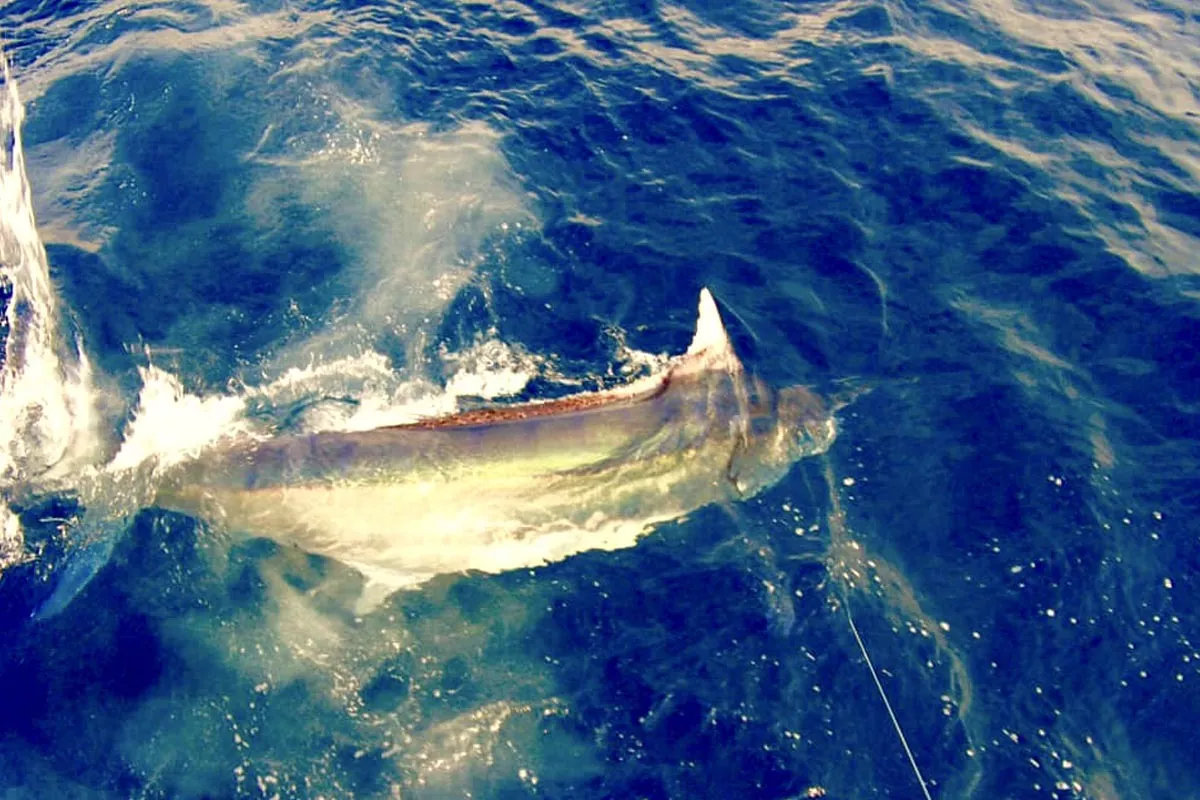
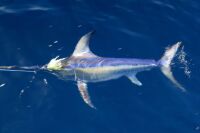
Billfish Temperature Preferences
Billfish species demonstrate distinct temperature preferences that experienced captains use to narrow their search areas effectively. Blue marlin typically prefer water temperatures between 74-82°F, while black marlin show similar preferences in the 72-82°F range. Sailfish thrive in slightly warmer conditions, with peak activity occurring in 72-82°F water. Swordfish, being deeper-dwelling fish, often feed in cooler surface waters ranging from 64-72°F, particularly during nighttime hours.
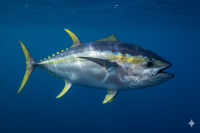
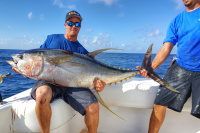
Tuna and Pelagic Gamefish
Yellowfin tuna demonstrate strong preferences for water temperatures between 72-82°F, often concentrating along the warm edges of temperature breaks. Wahoo, being more temperature-tolerant, remain active across a broader range from 64-82°F, making them excellent target species when conditions vary. Dolphin fish (mahi-mahi) prefer the 72-78°F range and frequently concentrate around floating debris in these optimal temperatures.
Reading SST Charts Like a Professional
Mastering the art of satellite fishing maps interpretation requires understanding multiple data layers that work together to create a complete picture of productive fishing conditions. While temperature forms the foundation of your analysis, combining it with additional oceanographic data dramatically improves your ability to locate fish.
Essential Data Layers Beyond Temperature
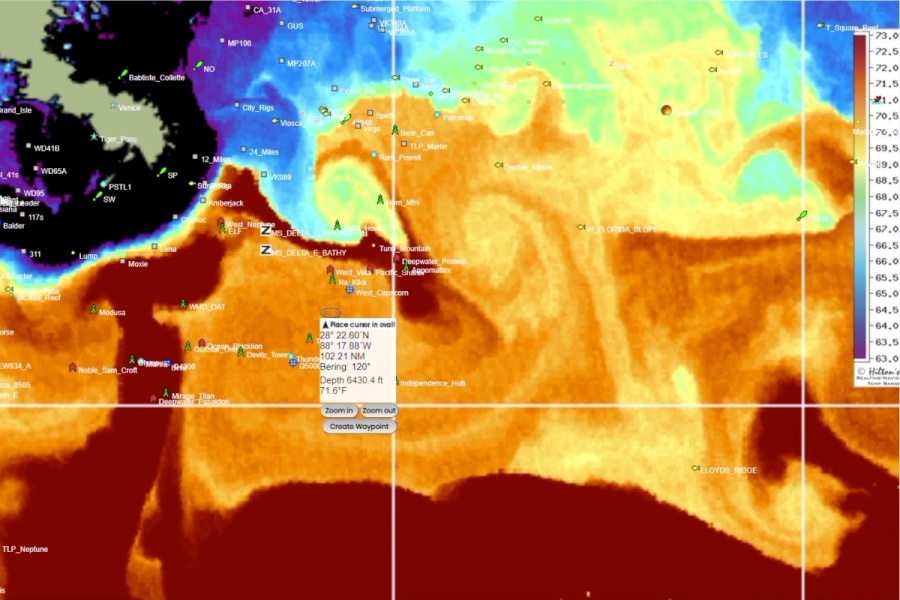
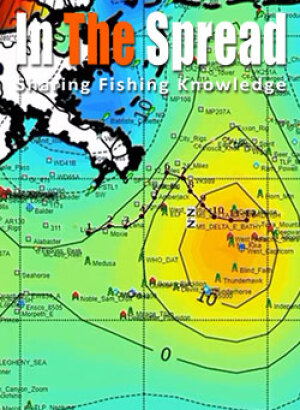
Modern SST services provide four critical data layers that serious anglers use to identify the most productive fishing zones. Sea surface temperature serves as your foundation layer, eliminating unproductive water and focusing your efforts on species-appropriate temperature ranges.
Chlorophyll concentration data reveals the ocean's productivity levels through color variations. Blue water indicates clear, low-chlorophyll conditions, while green and yellow areas show higher chlorophyll concentrations where baitfish typically congregate. The edges between these color zones, known as color breaks, often align with temperature breaks to create especially productive fishing areas.
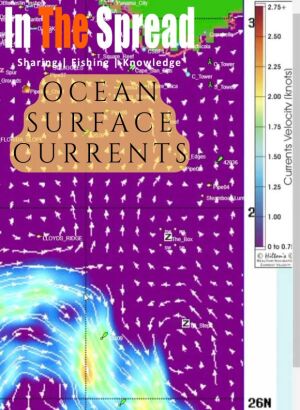
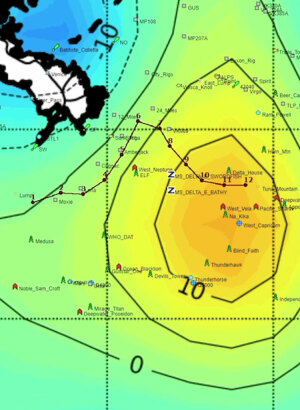
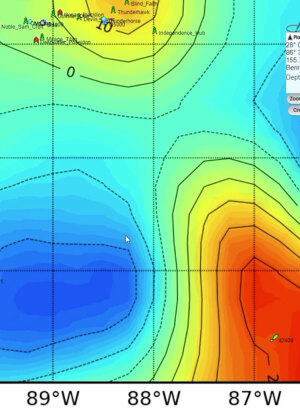
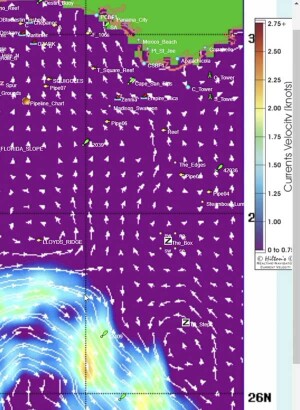
Sea surface height data reveals current patterns and water movement that influence where baitfish and predators will concentrate. Upwelling areas, where deeper nutrient-rich water rises to the surface, appear as depressions in sea surface height data and typically attract significant marine life.
Identifying Productive Water Features
Temperature breaks form the backbone of successful SST-based fishing strategies. Sharp temperature breaks, where water temperature changes rapidly over a short distance, typically concentrate the most fish. These dramatic transitions create natural barriers that funnel baitfish and attract predators.
Gradual temperature transitions can also be productive, particularly when they align with underwater structure or current edges. These subtle breaks often hold fish for extended periods, making them excellent areas for sustained fishing action.
Warm water eddies spinning off major current systems create temporary oases that attract baitfish and predators. These circular warm water masses can be incredibly productive, particularly when they contain the preferred temperature ranges for your target species. Cold water eddies can be equally productive, especially for species that prefer cooler conditions.
Regional SST Fishing Strategies
Different ocean regions present unique opportunities and challenges for SST fishing applications. Understanding regional characteristics helps you adapt general temperature-based fishing principles to your local waters.
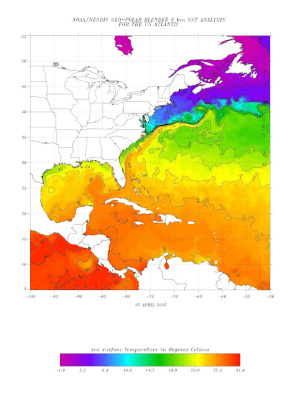
Atlantic Coast Temperature Patterns
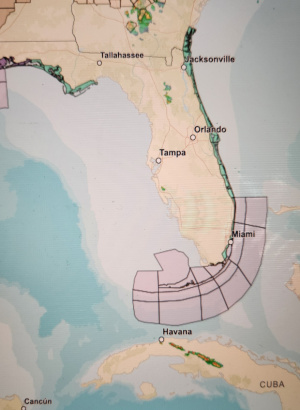
The Gulf Stream system dominates Atlantic coast fishing, creating a massive river of warm water flowing northward along the continental shelf. This current system generates numerous temperature breaks, eddies, and convergence zones that concentrate fish throughout the year.
During spring months, the Gulf Stream's western edge typically lies 20-40 miles offshore, creating dramatic temperature breaks where cooler shelf water meets the warm blue water. These breaks often hold massive concentrations of dolphin, wahoo, and billfish as they follow baitfish northward.
Summer patterns see the Gulf Stream push closer to shore in some areas while spinning off warm water eddies that can persist for weeks. These eddies become temporary fishing hotspots that savvy anglers track using daily SST updates.
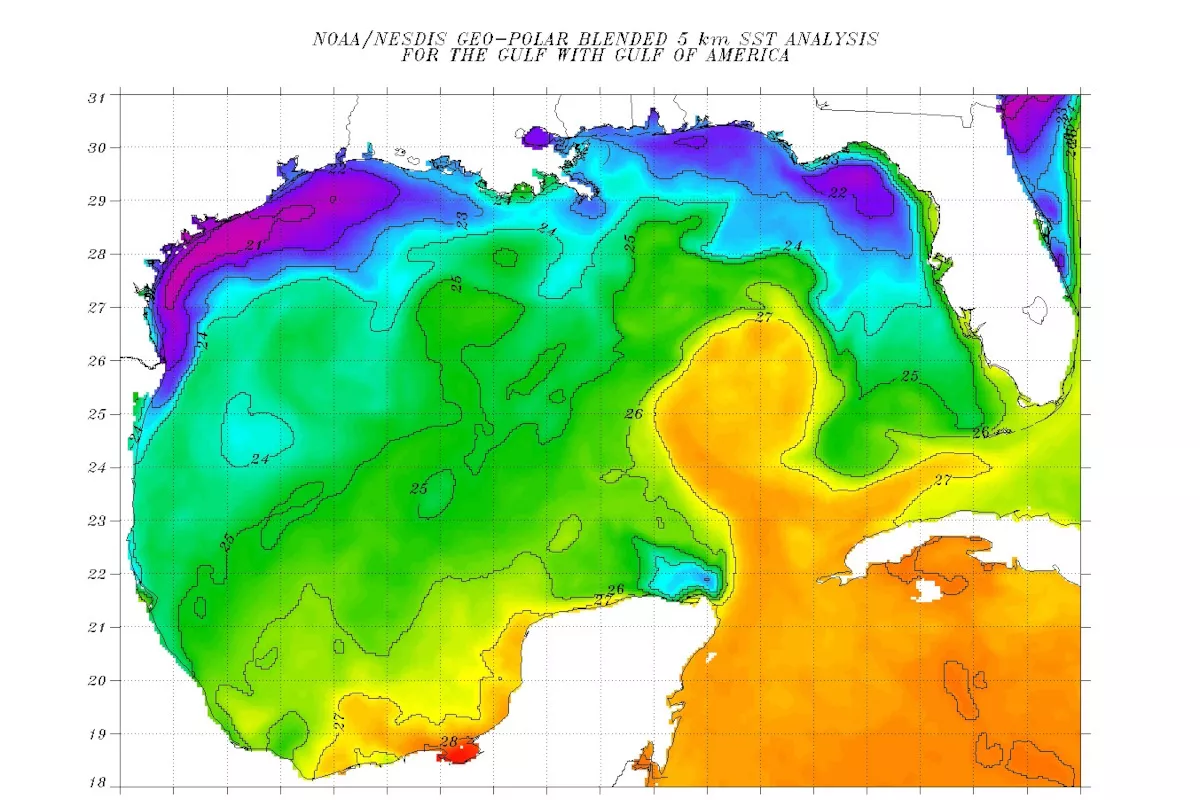
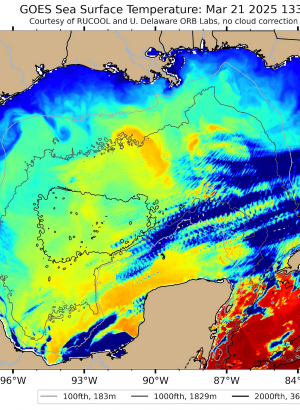
Gulf of Mexico Applications
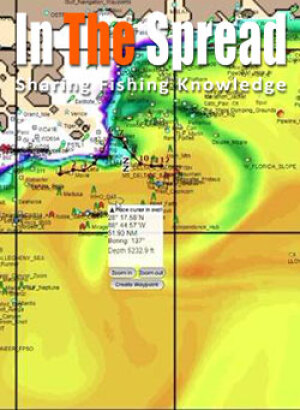
The Gulf of Mexico's Loop Current system creates unique fishing opportunities through its interaction with coastal waters and offshore structure. This massive current brings warm Caribbean water into the Gulf, generating eddies, temperature breaks, and upwelling areas that concentrate fish.
During summer months, the Loop Current often extends northward, bringing warm tropical water close to productive fishing areas around oil rigs and natural structure. The edges of this warm water mass frequently hold concentrations of yellowfin tuna, wahoo, and marlin.
Winter patterns see the Loop Current retreat southward, but its eddies continue to influence fishing throughout the Gulf. These warm water pockets provide refuges for tropical species during cooler months and can offer exceptional fishing when located using SST data.
Pacific Coast Dynamics
The California Current system creates distinctly different fishing patterns compared to Atlantic waters. This southward-flowing current brings cool, nutrient-rich water down the Pacific coast, generating upwelling areas and temperature breaks that support massive populations of baitfish and predators.
Seasonal upwelling events along the Pacific coast create some of the most productive fishing conditions in North American waters. These upwelling areas appear as cooler water masses in SST data and typically attract huge concentrations of anchovies, sardines, and the tuna, marlin, and other predators that feed on them.
Technology and Tools for Modern SST Fishing
Today's offshore fishing technology puts professional-grade oceanographic data in every angler's pocket. The evolution from basic paper charts to real-time mobile applications has democratized access to information that was once available only to commercial fishing fleets and research vessels.
Premium SST Services Comparison
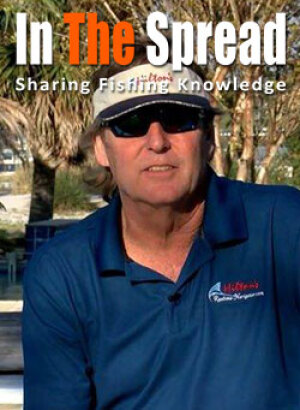
Hilton's Realtime Navigator stands as the pioneer in recreational fishing oceanography, offering comprehensive data packages specifically designed for serious anglers. Their service excels at tracking water movements over time, allowing users to predict where productive zones will be during their fishing trip rather than simply showing current conditions.
The platform's strength lies in its predictive capabilities, using current data to forecast how temperature breaks and productive areas will move throughout the day. This forward-looking approach helps anglers position themselves where the fish will be, not just where they currently are.
FishTrack has carved out a niche with its mobile-first approach, offering excellent smartphone and tablet applications optimized for on-water use. Their interface prioritizes simplicity and quick access to essential information, making it ideal for anglers who want powerful data without complexity.
Mobile Applications and Offline Capabilities
Modern fishing apps have solved one of the biggest challenges facing offshore anglers: accessing critical information when cellular service is unavailable. Today's applications allow you to download comprehensive SST data packages before leaving the dock, ensuring access to temperature information throughout your fishing trip.
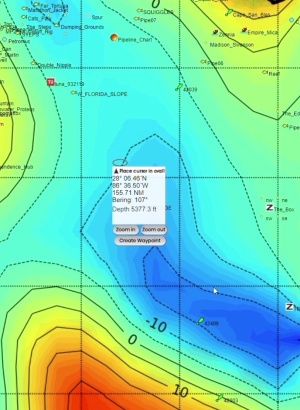
GPS functionality continues to work accurately even without cellular service, allowing you to track your position relative to downloaded temperature breaks and productive zones. This capability transforms your smartphone or tablet into a professional navigation tool for temperature-based fishing.
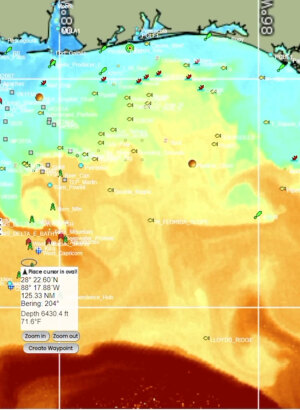
The most effective applications offer waypoint management systems that let you mark productive areas for future reference. Building a personal database of successful fishing locations and the temperature conditions that made them productive creates invaluable long-term fishing intelligence.
Learn More About Satellite Tech for Fishing

Pre-Trip Planning Strategy
Successful fishing temperature charts utilization begins long before you leave the dock. Professional captains typically begin analyzing SST data 5-7 days before a planned fishing trip, tracking how temperature patterns develop and predicting where productive conditions will exist on fishing day.
Seven-Day Analysis Protocol
Understanding how temperature patterns evolve over time provides crucial insights into where fish will be during your trip. Start by examining historical patterns for your planned fishing dates, looking for recurring features like seasonal temperature breaks or annual migration timing.
Current pattern analysis reveals how temperature breaks are moving and whether they're strengthening or weakening. Strengthening breaks often concentrate more fish, while weakening breaks may signal that fish are dispersing to other areas.
Weather impact assessment helps you understand how approaching weather systems will affect water conditions. Strong fronts can strengthen temperature breaks, while calm conditions may allow breaks to weaken or shift position.
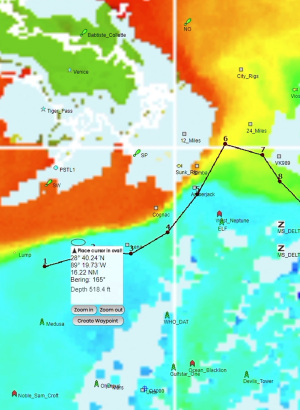
Creating Effective Waypoints and Routes
Fuel-efficient route planning becomes critical when fishing areas are far from port. SST data helps you identify the most promising areas and plan routes that maximize fishing time while minimizing fuel consumption.
Primary fishing areas should align with your target species' preferred temperatures and show signs of recent fish activity. These might include temperature breaks near structure, warm water eddies, or convergence zones with good bait concentrations.
Backup locations ensure that you have alternatives if primary areas don't produce or if weather forces you to adjust your plans. Identifying multiple productive zones before leaving port prevents wasted time searching for alternatives on the water.
On-Water Applications
Translating pre-trip SST analysis into on-water success requires understanding how to validate satellite data with real-time observations and make tactical adjustments based on actual conditions.
Real-Time Condition Assessment
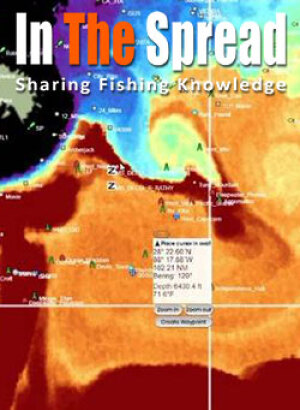
Water color verification helps confirm that satellite data accurately reflects current conditions. Sharp color changes visible on the surface often indicate the temperature breaks shown in your SST data. When these align, you've found high-probability fishing areas.
Temperature validation using fish finder sensors provides ground-truth data that helps you fine-tune your understanding of satellite information. Small discrepancies are normal, but major differences might indicate that conditions have changed since the satellite data was collected.
Current observation through debris movement, bird activity, and water surface conditions helps you understand how baitfish and predators might be positioned along temperature breaks. Strong currents often push bait along temperature boundaries, creating moving feeding opportunities.
Tactical Adjustments and Documentation
Adapting to changing conditions separates successful anglers from those who stick rigidly to pre-trip plans. When temperature breaks have moved from predicted positions, use current observations and real-time GPS data to locate the new productive zones.
Recording successful conditions builds valuable long-term fishing intelligence. Note the exact temperature ranges, color conditions, current direction, and other factors present when you find fish. This information becomes invaluable for future fishing trips in similar conditions.
Pattern recognition develops over time as you document successful fishing conditions. Look for recurring themes like specific temperature differentials, particular color combinations, or certain current directions that consistently produce fish.
Advanced SST Fishing Techniques
Professional captains use sophisticated strategies that go beyond basic temperature break fishing, incorporating multiple data layers and predictive analysis to maximize their success rates.
Predicting Fish Movement Patterns
Current integration with temperature data reveals how baitfish and predators move along thermal boundaries throughout the day. Understanding these movement patterns allows you to position yourself where fish will be rather than where they currently are.
Tidal influence affects how temperature breaks interact with underwater structure and current flow. Many productive temperature breaks strengthen during certain tidal phases while weakening during others. Learning these patterns for your local areas dramatically improves your timing.
Daily thermal cycles cause temperature breaks to shift position as surface heating and cooling occurs. Morning positions often differ significantly from afternoon locations, particularly in shallow areas or near shore.
Multi-Day Pattern Analysis
Seasonal progression tracking reveals how productive fishing areas move throughout the year. Many temperature-based fishing opportunities follow predictable seasonal patterns that experienced anglers use to plan their fishing calendars.
Historical comparison helps you understand whether current conditions are typical for the time of year or represent unusual opportunities. Exceptional fishing often occurs when temperature patterns deviate from normal seasonal progression.
Long-term trend analysis identifies multi-year patterns that affect fishing success. Understanding cycles like El Niño/La Niña, Atlantic Multidecadal Oscillation, or Pacific Decadal Oscillation helps you anticipate exceptional fishing years.
Species-Specific Temperature Strategies
Different fish species require tailored approaches that account for their unique temperature preferences, feeding behaviors, and seasonal movement patterns.
Billfish Temperature Tactics
Marlin fishing benefits from focusing on the warm edges of temperature breaks, particularly where water temperatures range from 76-80°F. These fish often cruise along thermal boundaries, following schools of flying fish and other preferred prey species.
Sailfish concentrate in areas where temperature breaks create upwelling or current convergences that concentrate baitfish. Look for areas where 74-78°F water meets slightly cooler or warmer masses, particularly near underwater structure.
Tuna Temperature Applications
Yellowfin tuna fishing reaches peak effectiveness when you locate areas where 76-80°F water contains abundant baitfish. These fish often school in large numbers along major temperature breaks, creating opportunities for multiple hookups.
Bluefin tuna tolerate much cooler water than other tuna species, often feeding effectively in 62-70°F conditions. Look for areas where these temperatures intersect with heavy baitfish concentrations or structure that attracts smaller fish.
How often are SST charts updated?
Premium SST services typically provide 6-12 updates daily, depending on satellite passes and cloud cover conditions. This frequent updating ensures you have access to current information for tactical decision-making on the water.
Can you use SST data in cloudy conditions?
Modern SST services use microwave sensors and advanced algorithms to provide "cloud-free" temperature data even when optical sensors cannot penetrate cloud cover. This ensures reliable information regardless of weather conditions.
What's the difference between free and premium SST services?
Free services offer basic temperature information with limited resolution and update frequency. Premium services provide higher resolution data, more frequent updates, additional data layers like chlorophyll and currents, and specialized fishing-focused features.
How accurate are mobile fishing apps without cellular service?
Most quality fishing apps cache comprehensive data when you have service and continue functioning offline using GPS. Your position tracking remains accurate, though you won't receive updated SST information until cellular service returns.
Which matters more: temperature or underwater structure?
Both factors are critically important, but the ideal fishing conditions occur when preferred temperature ranges overlap with productive underwater structure. Neither factor alone is as powerful as their combination.
How far in advance can you predict productive fishing conditions?
SST data is most reliable for 1-3 day predictions, though experienced users can identify favorable patterns up to a week in advance. Weather events can dramatically alter conditions, making shorter-term planning more accurate.
What temperature accuracy do you need for effective fishing?
Most fishing applications require temperature accuracy within 1-2°F. Premium SST services typically provide accuracy within 0.5-1°F, which is more than sufficient for recreational fishing applications.
Getting Started with Temperature-Based Fishing
Beginning your journey into SST fishing requires understanding the essential tools, developing basic skills, and building experience through practical application.
Essential Equipment and Setup
Start with a quality smartphone or tablet capable of running modern fishing applications. Most current devices have sufficient processing power and screen resolution for effective SST chart viewing and GPS navigation.
Choose one premium SST service initially rather than trying multiple platforms simultaneously. Each service has its own interface and interpretation methods, so developing expertise with one platform before expanding to others produces better results.
Download offline chart packages before every fishing trip, ensuring you have access to critical temperature information even when cellular service is unavailable. Plan for larger data downloads when covering extensive fishing areas.
Building Experience and Expertise
Start with local fishing areas where you can easily validate SST predictions against actual fishing results. This controlled learning environment helps you understand how satellite data translates to real-world fishing conditions.
Document both successful and unsuccessful fishing trips, noting the SST conditions present during each outing. Building this personal database creates valuable long-term fishing intelligence specific to your local waters and target species.
Practice interpreting SST data during poor weather periods when you cannot fish. This desktop analysis develops pattern recognition skills and helps you understand seasonal trends without the pressure of making real-time fishing decisions.
Maximizing Your SST Investment
Fishing temperature charts represent one of the most significant technological advances in recreational fishing, offering unprecedented access to the oceanographic data that drives fish behavior. Success with this technology requires understanding not just how to read the data, but how to integrate it with traditional fishing knowledge and real-time observations.
The key to long-term success lies in developing a systematic approach that combines pre-trip analysis, on-water validation, and thorough documentation of results. This process creates a feedback loop that continuously improves your ability to interpret temperature data and predict fishing success.
Remember that SST data is a tool to enhance your fishing skills, not replace them. The most successful anglers combine temperature analysis with traditional fishing knowledge, local expertise, and careful observation of current conditions. When these elements work together, the results can be truly exceptional.
As satellite technology continues to advance and mobile applications become more sophisticated, the gap between professional and recreational fishing capabilities continues to narrow. Today's serious recreational anglers have access to information that rivals what commercial fishing fleets used just a few years ago.
Additional Resources on Satellite Maps for Fishing
Login
to leave a review.
User Reviews
There are no reviews yet.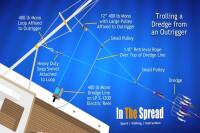
Complete Dredge Pulley Setup Guide
Saltwater
12.28.2020
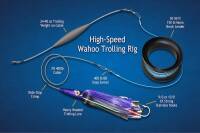
High Speed Wahoo Trolling Rig
Saltwater
09.07.2018

Best Bait for Wahoo
Saltwater
12.30.2023

Fishing Gulf of Mexico Inshore Waters
Saltwater
11.28.2023
Pinfish - A Comprehensive Guide
Saltwater
11.10.2023
0