Start fishing better with FREE Weekly Video Tips delivered straight to your email.
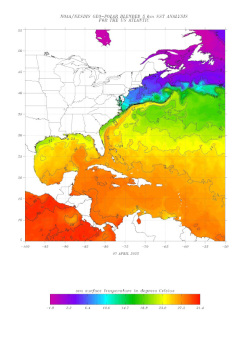
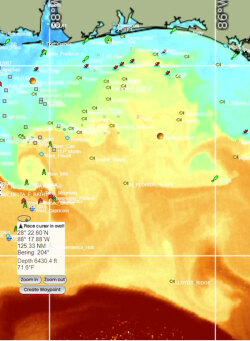
sea surface temperature
-
2019, Reading Sea Surface Temperature Charts for Offshore Fishing
Blue marlin preferring 78 to 88 degrees differs from wahoo favoring cooler break edges, making species-specific SST interpretation critical. Learn identifying temperature gradients where water masses collide, why breaks without chlorophyll may hold no fish despite perfect temps, and how daily shifts mean yesterday's productive water may be miles from current locations.
WATCH NOW -
2025, Reading SST Charts to Find Offshore Gamefish
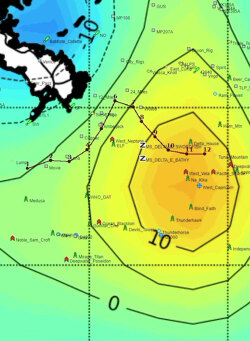
Sea surface temperature charts show you the ocean's thermal structure before you run a mile. Learn to identify the breaks, eddies, and upwellings that concentrate baitfish and pelagic predators, match those features to species-specific temperature ranges, and layer in chlorophyll and altimetry data to build a high-confidence plan the night before your trip.
READ MORE -
2025, Reading a Fishing Forecast: Data, Tools, and Decisions
A productive fishing forecast pulls from satellite oceanography, tidal data, barometric pressure, and celestial timing. Each data layer narrows the probability of where fish will be and when they will feed. This article breaks down what each variable tells you, how the layers work together, and how experienced anglers translate data into decisions before they leave the dock.
READ MORE -
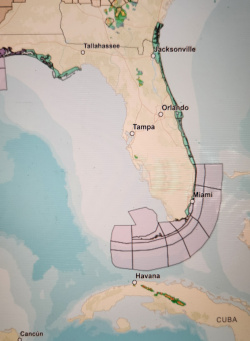
2024, Using Satellite Fishing Maps Before You Head Offshore
Satellite fishing maps give offshore anglers a real-time picture of ocean conditions before leaving the dock. Learning to read SST charts, chlorophyll data, altimetry, and current edges, and knowing how to layer them together, is one of the highest-leverage pre-trip skills a serious offshore angler can develop.
READ MORE -
2020, Fishing Temperature Charts: Complete Guide to SST Data for Offshore Success
Sea surface temperature analysis eliminates guesswork in offshore fishing by revealing where target species concentrate along thermal boundaries. Learn to interpret SST charts, identify productive temperature breaks, and position yourself where fish aggregate before competitors arrive.
READ MORE